Activity diagrams
The activity diagram is possibly one modeling element which was not present in any of the predecessors of UML. No such diagrams were present either in the works of Booch, Jacobson, or Rumbaugh. It is possibly based on the event diagram of Odell [1992] through the notation is very different from that used by Odell. The activity diagram focuses on representing activities or chunks of processing which may or may not correspond to the methods of classes. An activity is a state with an internal action and one or more outgoing transitions which automatically follow the termination of the internal activity. If an activity has more than one outgoing transitions, then these must be identified through conditions. An interesting feature of the activity diagrams is the swim lanes. Swim lanes enable you to group activities based on who is performing them, e.g. academic department vs. hostel office. Thus, swim lanes subdivide activities based on the responsibilities of some components. The activities in a swim lane can be assigned to some model elements, e.g. classes or some component, etc.
Activity diagrams are normally employed in business process modeling. This is carried out during the initial stages of requirements analysis and specification. Activity diagrams can be very useful to understand complex processing activities involving many components. Later these diagrams can be used to develop interaction diagrams which help to allocate activities (responsibilities) to classes.
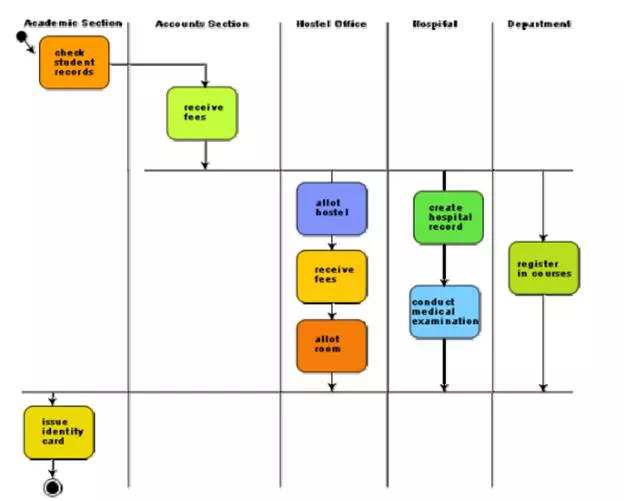
The student admission process in IIT is shown as an activity diagram. This shows the part played by different components of the Institute in the admission procedure. After the fees are received at the account section, parallel activities start at the hostel office, hospital, and the Department. After all these activities complete (this synchronization is represented as a horizontal line), the identity card can be issued to a student by the Academic section.
Activity diagram for student admission procedure at IIT
Activity diagrams vs. procedural flow charts
Activity diagrams are similar to the procedural flow charts. The difference is that activity diagrams support description of parallel activities and synchronization aspects involved in different activities.
State chart diagram
A state chart diagram is normally used to model how the state of an object changes in its lifetime. State chart diagrams are good at describing how the behavior of an object changes across several use case executions. However, if we are interested in modeling some behavior that involves several objects collaborating with each other, state chart diagram is not appropriate. State chart diagrams are based on the finite state machine (FSM) formalism.
An FSM consists of a finite number of states corresponding to those of the object being modeled. The object undergoes state changes when specific events occur. The FSM formalism existed long before the object-oriented technology and has been used for a wide variety of applications. Apart from modeling, it has even been used in theoretical computer science as a generator for regular languages.
A major disadvantage of the FSM formalism is the state explosion problem. The number of states becomes too many and the model too complex when used to model practical systems. This problem is overcome in UML by using state charts. The state chart formalism was proposed by David Hare [1990]. A state chart is a hierarchical model of a system and introduces the concept of a composite state (also called nested state).
Actions are associated with transitions and are considered to be processes that occur quickly and are not interruptible. Activities are associated with states and can take longer. An activity can be interrupted by an event.
The basic elements of the state chart diagram are as follows:
• Initial state. This is represented as a filled circle.
• Final state. This is represented by a filled circle inside a larger circle.
• State. These are represented by rectangles with rounded corners.
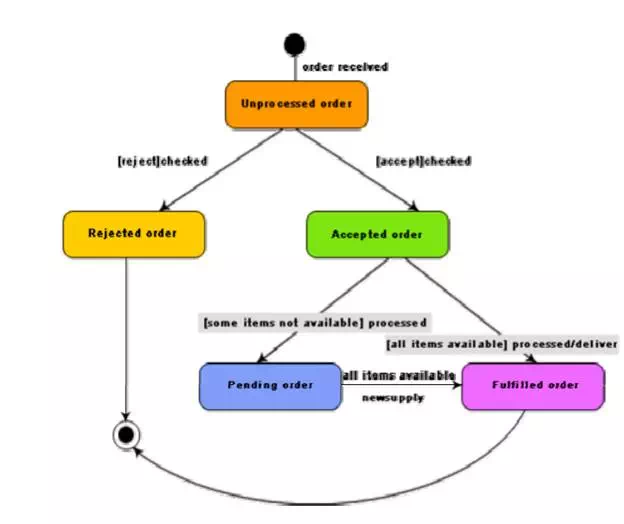
• Transition. A transition is shown as an arrow between two states. Normally, the name of the event which causes the transition is places along side the arrow. A guard to the transition can also be assigned. A guard is a Boolean logic condition. The transition can take place only if the grade evaluates to true. The syntax for the label of the transition is shown in 3 parts: event[guard]/action.
State chart diagram for an order object
Activity diagram vs. State chart diagram
• Both activity and state chart diagrams model the dynamic behavior of the system. Activity diagram is essentially a flowchart showing flow of control from activity to activity. A state chart diagram shows a state machine emphasizing the flow of control from state to state.
• An activity diagram is a special case of a state chart diagram in which all or most of the states are activity states and all or most of the transitions are triggered by completion of activities in the source state (An activity is an ongoing non-atomic execution within a state machine).
• Activity diagrams may stand alone to visualize, specify, and document the dynamics of a society of objects or they may be used to model the flow of control of an operation. State chart diagrams may be attached to classes, use cases, or entire systems in order to visualize, specify, and document the dynamics of an individual object.