
In addition to the mathematical and empirical analyses of algorithms, there is yet a third way to study algorithms. It is called algorithm visualization and can be defined as the use of images to convey some useful information about algorithms. That information can be a visual illustration of an algorithm’s operation, of its per-formance on different kinds of inputs, or of its execution speed versus that of other algorithms for the same problem. To accomplish this goal, an algorithm visualiza-tion uses graphic elements—points, line segments, two- or three-dimensional bars, and so on—to represent some “interesting events” in the algorithm’s operation.
There are two principal variations of algorithm visualization:
Static algorithm visualization
Dynamic algorithm visualization, also called algorithm animation
Static algorithm visualization shows an algorithm’s progress through a series of still images. Algorithm animation, on the other hand, shows a continuous, movie-like presentation of an algorithm’s operations. Animation is an arguably more sophisticated option, which, of course, is much more difficult to implement.
Early efforts in the area of algorithm visualization go back to the 1970s. The watershed event happened in 1981 with the appearance of a 30-minute color sound film titled Sorting Out Sorting. This algorithm visualization classic was produced at the University of Toronto by Ronald Baecker with the assistance of D. Sherman [Bae81, Bae98]. It contained visualizations of nine well-known sorting algorithms (more than half of them are discussed later in the book) and provided quite a convincing demonstration of their relative speeds.
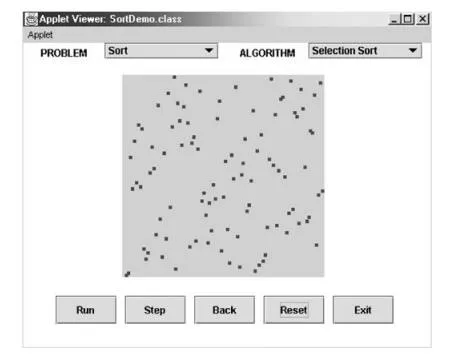
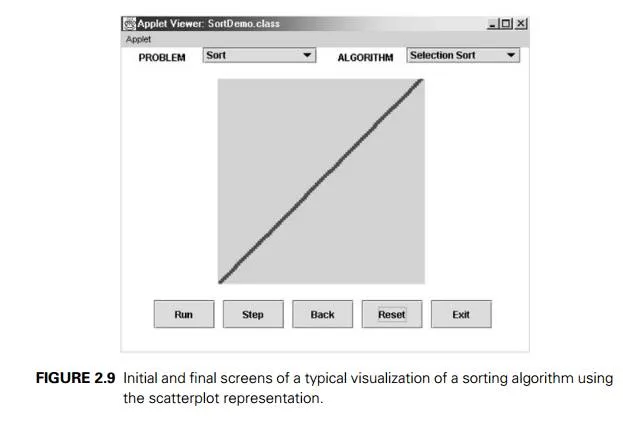
The success of Sorting Out Sorting made sorting algorithms a perennial fa-vorite for algorithm animation. Indeed, the sorting problem lends itself quite naturally to visual presentation via vertical or horizontal bars or sticks of different heights or lengths, which need to be rearranged according to their sizes (Figure 2.8). This presentation is convenient, however, only for illustrating actions of a typical sorting algorithm on small inputs. For larger files, Sorting Out Sorting used the ingenious idea of presenting data by a scatterplot of points on a coordinate plane, with the first coordinate representing an item’s position in the file and the second one representing the item’s value; with such a representation, the process of sorting looks like a transformation of a “random” scatterplot of points into the points along a frame’s diagonal (Figure 2.9). In addition, most sorting algorithms
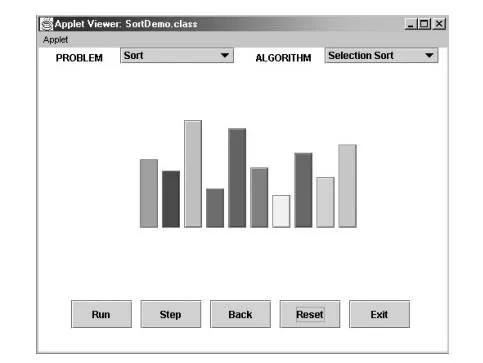
work by comparing and exchanging two given items at a time—an event that can be animated relatively easily.
Since the appearance of Sorting Out Sorting, a great number of algorithm animations have been created, especially after the appearance of Java and the
World Wide Web in the 1990s. They range in scope from one particular algorithm to a group of algorithms for the same problem (e.g., sorting) or the same applica-tion area (e.g., geometric algorithms) to general-purpose animation systems. At the end of 2010, a catalog of links to existing visualizations, maintained under the NSF-supported AlgoVizProject, contained over 500 links. Unfortunately, a survey of existing visualizations found most of them to be of low quality, with the content heavily skewed toward easier topics such as sorting [Sha07].
There are two principal applications of algorithm visualization: research and education. Potential benefits for researchers are based on expectations that algo-rithm visualization may help uncover some unknown features of algorithms. For example, one researcher used a visualization of the recursive Tower of Hanoi algo-rithm in which odd- and even-numbered disks were colored in two different colors. He noticed that two disks of the same color never came in direct contact during the algorithm’s execution. This observation helped him in developing a better non-recursive version of the classic algorithm. To give another example, Bentley and McIlroy [Ben93] mentioned using an algorithm animation system in their work on improving a library implementation of a leading sorting algorithm.
The application of algorithm visualization to education seeks to help students learning algorithms. The available evidence of its effectiveness is decisively mixed. Although some experiments did register positive learning outcomes, others failed to do so. The increasing body of evidence indicates that creating sophisticated software systems is not going to be enough. In fact, it appears that the level of student involvement with visualization might be more important than specific features of visualization software. In some experiments, low-tech visualizations prepared by students were more effective than passive exposure to sophisticated software systems.
To summarize, although some successes in both research and education have been reported in the literature, they are not as impressive as one might expect. A deeper understanding of human perception of images will be required before the true potential of algorithm visualization is fulfilled.