The risk and uncertainty rises multifold with respect to the size of the project, even when the project is developed according to set methodologies.
There are tools available, which aid for effective project management. A few are described –
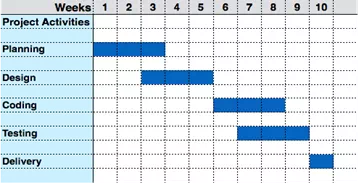
Gantt Chart
Gantt charts was devised by Henry Gantt (1917). It represents project schedule with respect to time periods. It is a horizontal bar chart with bars representing activities and time scheduled for the project activities.
PERT Chart
PERT (Program Evaluation & Review Technique) chart is a tool that depicts project as network diagram. It is capable of graphically representing main events of project in both parallel and consecutive way. Events, which occur one after another, show dependency of the later event over the previous one.
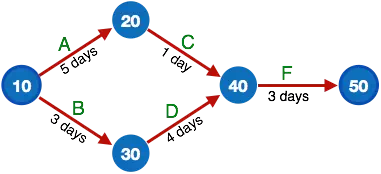
Events are shown as numbered nodes. They are connected by labeled arrows depicting sequence of tasks in the project.
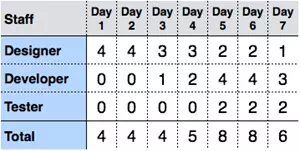
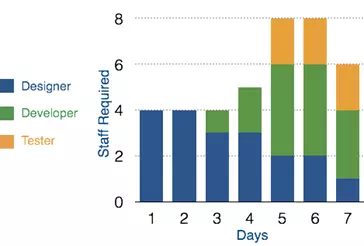
Resource Histogram
This is a graphical tool that contains bar or chart representing number of resources (usually skilled staff) required over time for a project event (or phase). Resource Histogram is an effective tool for staff planning and coordination.
Critical Path Analysis
This tools is useful in recognizing interdependent tasks in the project. It also helps to find out the shortest path or critical path to complete the project successfully. Like PERT diagram, each event is allotted a specific time frame. This tool shows dependency of event assuming an event can proceed to next only if the previous one is completed.
The events are arranged according to their earliest possible start time. Path between start and end node is critical path which cannot be further reduced and all events require to be executed in same order.