
Modern software systems can be extraordinarily complex. A single user action—such as opening an online store, submitting a payment, or uploading a file—may trigger dozens of services, databases, caches, APIs, message queues, and cloud infrastructure components.
When everything works correctly, users rarely notice this complexity. But when something goes wrong, engineers face a difficult question:
What exactly is happening inside the system? 🧠💻
This is where observability becomes essential.
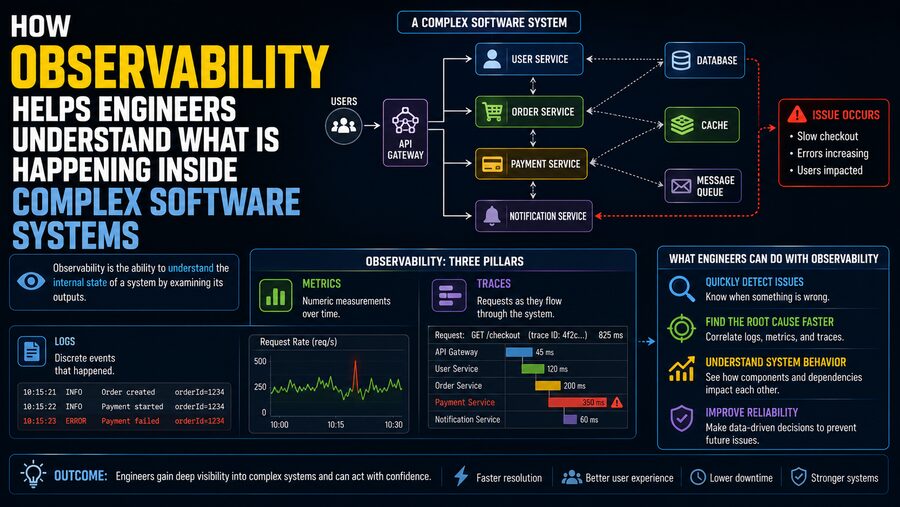
Observability is the ability to understand the internal state and behavior of a software system by examining the information it produces. Engineers use telemetry such as logs, metrics, traces, events, and profiles to investigate failures, identify performance bottlenecks, understand dependencies, and determine why a system is behaving in a particular way.
Rather than simply telling engineers that something is broken, strong observability helps explain where, when, and why the problem occurred.
🧩 Why Modern Software Is Difficult to Understand
Traditional applications were often relatively centralized.
A program might run on one server, connect to one database, and write errors to a local log file. If something went wrong, an engineer could inspect that server directly.
Modern cloud applications may look completely different.
A request could travel through:
Mobile app → CDN → Load balancer → API gateway → Authentication service → Application service → Database → Payment service → Message queue
Each component may run on different machines, containers, or cloud platforms.
Services may automatically scale up and down. Containers may exist for only a few minutes. Network requests may cross multiple regions.
Because of this distributed architecture, simply looking at one machine often reveals only a tiny part of the problem.
Observability provides a way to reconstruct the bigger picture. 🌐
👀 Monitoring vs. Observability
Monitoring and observability are closely related, but they are not exactly the same.
Monitoring usually focuses on predefined questions.
For example:
- Is CPU usage above 90%?
- Is the website responding?
- Is database latency too high?
- Are errors exceeding a threshold?
Monitoring is excellent for detecting known failure conditions.
Observability goes further.
It helps engineers investigate questions they may not have anticipated in advance.
For example:
Why are payment requests from one region suddenly taking twice as long even though overall server CPU appears normal?
Answering that question may require combining traces, logs, database metrics, infrastructure data, and deployment information.
Monitoring tells engineers that something may be wrong.
Observability helps them understand what is happening and why.
📊 The Three Traditional Pillars of Observability
Observability is often described using three major categories of telemetry:
- Metrics
- Logs
- Traces
Each provides a different perspective on the system.
Used together, they can dramatically improve troubleshooting.
📈 1. Metrics Show System Trends
Metrics are numerical measurements recorded over time.
Common metrics include:
- CPU utilization
- Memory usage
- Requests per second
- Error rate
- Database query latency
- Queue depth
- Disk usage
- Network throughput
Metrics provide an excellent high-level view of system health.
For example, suppose a web application normally handles 5,000 requests per second with an average response time of 150 milliseconds.
Suddenly, latency rises to 900 milliseconds.
A dashboard can immediately reveal that something unusual has happened.
Engineers might then examine other metrics to determine whether the slowdown corresponds with increased CPU usage, database load, memory pressure, or network activity.
Metrics are especially useful for answering:
“What changed?”
and
“When did it change?”
📝 2. Logs Explain Individual Events
Logs are records generated by applications, operating systems, databases, and infrastructure components.
A log entry might describe:
- A user authentication attempt
- A failed database query
- An application exception
- A service restart
- A payment request
- A configuration change
For example:
Payment failed: downstream bank API timeout
This message provides detailed context that a simple error-rate metric cannot.
Logs can include fields such as:
- Timestamp
- Service name
- User or request identifier
- Error code
- Region
- Hostname
- Application version
Structured logs make it easier to search and analyze this information automatically.
If a metric shows that errors suddenly increased, engineers can inspect logs from the same period to determine exactly what kinds of errors occurred.
🧵 3. Distributed Traces Follow Requests Across Services
Traces are particularly important in distributed systems.
A distributed trace follows a request as it travels through multiple services.
Suppose a user clicks “Place Order.”
The request might involve:
Frontend → Order service → Inventory service → Payment service → Database
A trace can show each of these operations as a separate span.
Each span records information such as:
- Start time
- Duration
- Service
- Operation
- Status
- Relationships to other spans
This makes it possible to see where time was spent.
For example:
- Order service: 20 ms
- Inventory service: 40 ms
- Payment service: 1,500 ms
- Database: 25 ms
The trace immediately suggests that the payment service is responsible for most of the delay.
Without tracing, engineers might spend hours investigating the wrong components.
🔗 Correlation Makes Telemetry More Powerful
Logs, metrics, and traces become especially valuable when they can be correlated.
Imagine that a dashboard shows a sudden increase in API latency.
An engineer clicks the affected time period and discovers that most slow requests involve one particular service.
From there, the engineer opens a trace and sees a slow database call.
The associated logs reveal:
“Connection pool exhausted.”
Now the investigation has moved from a vague symptom to a specific technical cause.
This workflow demonstrates one of observability’s greatest strengths:
Metrics identify the problem → Traces locate the problem → Logs provide detailed context
Modern observability platforms increasingly connect these forms of telemetry automatically.
🚨 Observability and Alerting
Observability systems can generate alerts when important conditions occur.
Examples include:
- Error rate exceeds 5%
- Database latency exceeds 500 ms
- Disk space falls below 10%
- Queue backlog grows rapidly
- Service becomes unavailable
Good alerts should indicate meaningful user or business impact rather than merely reacting to every technical fluctuation.
Too many alerts create alert fatigue.
If engineers receive hundreds of low-value notifications, they may begin ignoring them.
Effective observability therefore involves carefully choosing which conditions require immediate attention.
🎯 Service-Level Indicators and Objectives
Organizations often define reliability using Service-Level Indicators (SLIs) and Service-Level Objectives (SLOs).
An SLI is a measurement of service behavior.
Examples include:
- Availability
- Request latency
- Error rate
- Successful transaction rate
An SLO defines the desired target.
For example:
99.95% of API requests should complete successfully each month.
Observability systems help track these objectives.
Instead of asking whether every server is perfectly healthy, engineers can focus on what matters most:
Are users receiving the expected level of service?
🧭 Finding the Root Cause of Failures
A visible failure is often only a symptom.
Suppose users report that an application occasionally returns an error.
The real cause could be:
- A database connection leak
- Network packet loss
- A faulty deployment
- An overloaded dependency
- Incorrect configuration
- Memory exhaustion
- A slow third-party API
Observability helps engineers follow the chain of evidence.
A trace might reveal that failures occur only when calling a specific dependency.
Logs from that service may show authentication failures.
Deployment metadata may reveal that the failures began immediately after a configuration change.
The problem can then be corrected at its actual source.
This process is known as root-cause analysis. 🔍
🌐 Observability in Microservices
Microservice architectures make observability especially important.
Instead of one large application, organizations may operate hundreds or thousands of relatively small services.
These services communicate through APIs and messaging systems.
A failure in one service can indirectly affect many others.
For example:
Recommendation service slows down → Product page waits longer → API gateway queues requests → User-facing latency increases
The user experiences a slow website even though the original problem began several layers deeper.
Distributed tracing and dependency maps help engineers understand these relationships.
☁️ Observability in Cloud Infrastructure
Cloud environments introduce additional complexity.
Applications may run across:
- Virtual machines
- Containers
- Kubernetes clusters
- Serverless functions
- Managed databases
- Object storage
- Cloud networking
Resources can appear and disappear dynamically.
A container that generated an error may no longer exist by the time an engineer investigates.
Centralized telemetry solves this problem by sending logs, metrics, and traces to systems where they remain available after the original resource disappears.
📦 Observability in Kubernetes
Kubernetes can automatically schedule, restart, and scale containerized applications.
This automation is powerful, but it creates many moving parts.
Engineers may need visibility into:
- Pods
- Containers
- Nodes
- Deployments
- Services
- Ingress traffic
- Cluster events
Suppose a container repeatedly restarts because it exceeds its memory limit.
An observability platform may show:
Memory usage rises → container exceeds limit → Kubernetes terminates pod → replacement pod starts
Without this visibility, users may simply experience intermittent failures.
🚀 Observability During Software Deployments
Many production incidents begin shortly after new software is deployed.
Observability helps teams compare system behavior before and after a release.
For example, engineers may notice:
- Error rate increased after version 4.2
- Database queries became 30% slower
- Memory usage steadily increased
- One API endpoint began timing out
Deployment markers on dashboards can make these relationships immediately visible.
Teams can then roll back the release or investigate the specific code changes responsible.
🧪 Observability and Testing in Production
Testing environments cannot perfectly reproduce every real-world condition.
Production systems contain:
- Actual user behavior
- Real traffic patterns
- Real infrastructure
- Third-party dependencies
- Large datasets
Observability allows engineers to safely examine how software behaves under actual operating conditions.
Techniques such as canary releases and feature flags may expose a new version to only a small percentage of users.
Engineers can then monitor telemetry before expanding the rollout.
🏷️ Why Metadata Matters
Telemetry becomes much more useful when it contains descriptive metadata.
A request might be tagged with:
- Service name
- Application version
- Data center
- Cloud region
- Customer type
- Endpoint
- Device category
Suppose error rates increase only for:
Version 6.1 + European region + mobile checkout
Without this metadata, the issue might be hidden inside overall averages.
With proper tags, engineers can isolate the affected population quickly.
📊 The Danger of Averages
Aggregated metrics can hide important behavior.
Suppose average response time is 200 milliseconds.
That sounds acceptable.
But the distribution might actually be:
- 95% of requests: 100 ms
- 5% of requests: 2 seconds
The average may conceal poor experiences for thousands of users.
Observability systems therefore frequently use percentiles.
For example:
p95 latency indicates that 95% of requests completed at or below that duration.
p99 latency focuses on even slower outliers.
These measurements provide a clearer view of tail performance.
🧠 High-Cardinality Data
Modern observability often involves high-cardinality data.
Cardinality refers to the number of unique values a field can contain.
A field such as region may have low cardinality because there are only a few possible regions.
A user_id or request_id may have millions of unique values.
High-cardinality information can be extremely valuable during debugging because engineers can isolate very specific groups or requests.
However, storing and querying large quantities of high-cardinality telemetry can be expensive.
Observability systems therefore need efficient data architectures.
🧬 Logs, Traces, and Context Propagation
Distributed tracing depends on passing context between services.
When Service A calls Service B, it forwards identifiers that allow both operations to be linked to the same trace.
Service B passes similar context to Service C.
The resulting telemetry can reconstruct the full request path.
Without context propagation, engineers might see logs from all three services but have difficulty determining which entries belong to the same user request.
Standardized telemetry frameworks make this easier.
🔧 OpenTelemetry and Standardization
OpenTelemetry is a widely used open-source framework for generating and collecting observability telemetry.
It provides common approaches for:
- Traces
- Metrics
- Logs
- Context propagation
- Instrumentation
Standardization allows applications to produce telemetry without being permanently tied to one backend platform.
This is valuable because organizations may change observability vendors or operate several analytics systems.
👨💻 Instrumentation
A system cannot be observable unless it produces useful information.
Adding the code or configuration needed to generate telemetry is called instrumentation.
Instrumentation may be:
- Manual
- Automatic
- Library-based
- Agent-based
For example, an application may automatically record every HTTP request duration.
Developers can also add custom instrumentation around important business operations.
An online retailer might measure:
- Checkout completion
- Payment authorization
- Inventory reservation
- Order fulfillment
This provides visibility not only into technical infrastructure but also into application behavior.
💼 Business Observability
Observability can connect technical performance with business outcomes.
Suppose infrastructure dashboards appear healthy, but completed purchases suddenly drop by 20%.
Business-oriented telemetry might reveal that one payment method is failing.
Engineers can then connect:
Technical failure → User experience → Business impact
This helps teams prioritize incidents according to their actual consequences.
🔐 Observability and Security
Observability data can also support security investigations.
Logs and events may reveal:
- Repeated authentication failures
- Suspicious API access
- Unexpected administrative actions
- Unusual traffic patterns
- Configuration changes
However, observability platforms are not substitutes for dedicated security systems.
They also need strong access controls because telemetry can contain sensitive operational information.
Organizations should avoid unnecessarily recording secrets, passwords, private tokens, or sensitive personal information.
💰 Observability Has a Cost
Collecting everything is rarely practical.
Large systems can generate terabytes of telemetry.
Costs may include:
- Storage
- Data transfer
- Indexing
- Query processing
- Instrumentation overhead
Engineers therefore make decisions about sampling and retention.
For example, a system may retain all error traces but only a fraction of successful requests.
Older telemetry may be archived or summarized.
Good observability balances detailed visibility with sustainable cost.
🎯 Sampling Traces
High-traffic systems may generate millions of traces.
Storing every trace can become expensive.
Sampling selects a subset for retention.
Random sampling might keep 1% of requests.
More intelligent approaches can prioritize unusual events.
For example:
- Keep 100% of errors
- Keep very slow requests
- Sample normal successful traffic at a lower rate
This preserves important diagnostic information while reducing storage requirements.
🧯 Observability During Incident Response
During an outage, engineers need fast answers.
A typical investigation might proceed like this:
- 🚨 Alert reports increased checkout failures.
- 📊 Dashboard shows the error began at 14:08.
- 🧵 Traces reveal failures inside the inventory service.
- 📝 Logs show database connection timeouts.
- 📈 Database metrics show maximum connections reached.
- 🚀 Deployment history shows a new version released at 14:05.
- 🔧 Engineers roll back the change.
- ✅ Error rates return to normal.
Without observability, each step might require manual investigation across different machines and teams.
With correlated telemetry, the diagnosis can become much faster.
⏱️ Reducing Mean Time to Resolution
A major operational goal is reducing Mean Time to Resolution (MTTR).
MTTR represents how long it typically takes to restore service after an incident.
Observability can reduce MTTR by helping engineers quickly answer:
- Which users are affected?
- Which service is failing?
- When did the problem begin?
- What changed?
- Which dependency is involved?
Faster diagnosis means shorter outages and less impact on users.
🛠️ Observability Helps Improve Software Before Incidents
Observability is not useful only during failures.
Engineers can analyze normal system behavior to identify future problems.
For example, telemetry may reveal that:
- Database storage is approaching capacity
- Memory consumption is gradually increasing
- A service becomes slower during peak traffic
- One API dependency has increasing latency
Teams can address these trends before they cause outages.
Observability therefore supports proactive engineering as well as reactive troubleshooting.
🤖 AI and Automated Observability
Modern observability platforms increasingly use statistical methods and machine learning to analyze telemetry.
Automated systems can help detect:
- Unusual latency
- Unexpected traffic patterns
- Changes in error behavior
- Correlated failures
- Resource anomalies
Some systems can automatically group related alerts or suggest likely causes.
AI can help engineers navigate massive telemetry datasets, although human judgment remains important when interpreting complex production behavior.
🔄 Continuous Improvement Through Observability
Telemetry can reveal which parts of software require architectural improvement.
If engineers repeatedly observe the same database becoming a bottleneck, they may redesign how data is accessed.
If a service frequently fails when another service becomes unavailable, they may introduce:
- Timeouts
- Retries
- Circuit breakers
- Caching
- Graceful degradation
In this way, observability does more than diagnose incidents.
It provides evidence that guides better system design.
🧭 Observability and Reliability Engineering
Site Reliability Engineering, commonly called SRE, relies heavily on observability.
SRE teams use telemetry to understand whether systems are meeting reliability goals.
They examine:
- Availability
- Latency
- Errors
- Traffic
- Saturation
Observability data can also support capacity planning.
If traffic increases 10% each month, engineers can use historical telemetry to predict when additional infrastructure will be required.
⚖️ Good Observability Is About Questions, Not Dashboards
A company can have hundreds of dashboards and still have poor observability.
The important question is whether engineers can use telemetry to understand unexpected system behavior.
Useful observability should help answer questions such as:
Why are users in one region experiencing slower requests?
Which service changed after the latest deployment?
Why does only one payment method fail?
Where is most request latency being introduced?
The ability to explore unfamiliar problems is more important than simply displaying large quantities of data.
🌍 Why Observability Matters More as Systems Grow
Small applications may be understandable through direct inspection.
As systems become larger, distributed, and more dynamic, that approach stops scaling.
A cloud platform might run thousands of service instances across multiple regions.
No engineer can manually inspect them all.
Observability transforms these enormous systems into something understandable by collecting structured signals and connecting related events.
It gives engineering teams a window into infrastructure that would otherwise be largely invisible. 🔎🌐
✨ Conclusion
Observability helps engineers understand complex software systems by turning internal behavior into measurable external signals.
Metrics reveal trends and overall system health. Logs provide detailed records of events. Distributed traces follow individual requests across services and expose where time or failures occur.
When these signals are connected with metadata, deployment information, infrastructure data, and service relationships, engineers can move from simply knowing that a problem exists to understanding its underlying cause.
Strong observability allows teams to detect failures faster, investigate unexpected behavior, reduce downtime, measure reliability, improve performance, and make better architectural decisions.
This capability becomes especially important in modern environments involving microservices, containers, cloud infrastructure, and dynamically changing resources. ☁️💻
Observability does not eliminate software failures. Instead, it makes those failures far less mysterious.
By providing engineers with evidence about what happened inside a system, when it happened, which components were involved, and how users were affected, observability transforms complex software from a collection of hidden processes into a system that can be explored, understood, and improved. 🔎⚙️