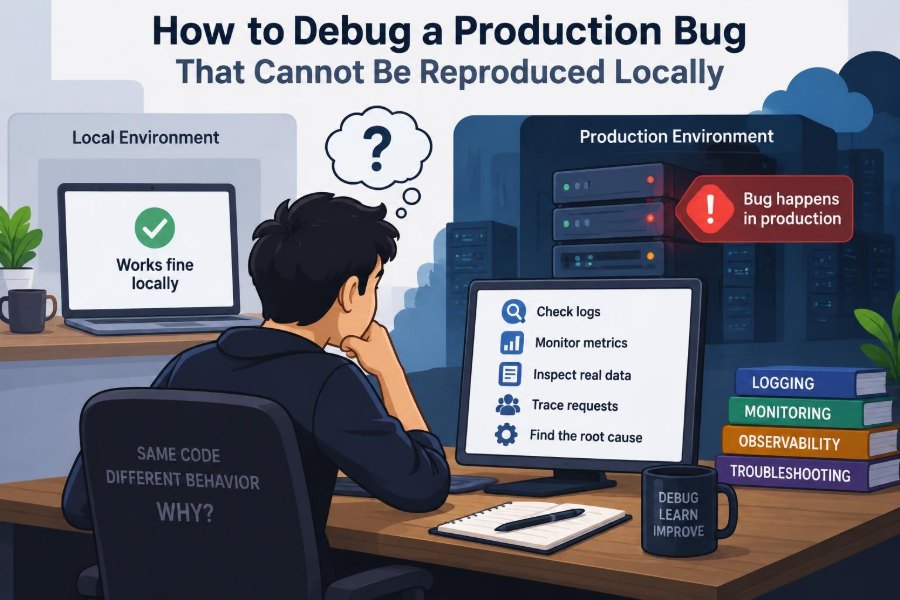

The alert arrives with a frustratingly familiar description: “Checkout sometimes fails for customers, but we cannot reproduce it.” The error may affect only a few requests, one browser version, a particular account state, or traffic from a single region. Your laptop behaves perfectly.
This is not evidence that the bug is imaginary. It is evidence that your local environment is missing one or more conditions that production supplies: real traffic patterns, persisted data, configuration, timing, dependency behavior, or infrastructure.
The instinct is to keep trying the same action locally until it breaks. That can waste hours and may even push a team toward speculative fixes. A better approach treats the incident as an investigation: preserve evidence, form testable hypotheses, and narrow the difference between a failing request and a successful one.
Debugging an unreproducible production bug is less about heroic intuition than disciplined observation. The goal is not necessarily to recreate the entire production system on a laptop. It is to explain one failure well enough to verify a safe fix.
🔎 Reframe “Cannot Reproduce” as a Missing Condition
“Cannot reproduce locally” usually means the reproduction conditions are incomplete, not that the code is correct. A production failure is the output of code plus inputs, data, configuration, time, dependencies, and execution environment.
Think of a bug as a combination lock. Your local test may have the right code path but the wrong tenant, feature flag, cache state, request ordering, or payload shape. The investigation is about identifying which dial differs.
🚨 Stabilize the Incident Before Deep Debugging
First decide whether users are still being harmed. If failures are ongoing, prioritize a mitigation such as disabling a feature flag, rolling back a recent release, reducing traffic to a failing dependency, or routing requests through a known-safe path.
Mitigation and root-cause analysis are separate jobs. A rollback may protect users quickly but erase a valuable clue if you do not record the release version, timing, affected requests, and observed symptoms first.
📝 Write a Precise Problem Statement
Vague reports create vague searches. Replace “the API is broken” with a statement that includes the operation, symptom, scope, and time window.
For example: “Between 14:05 and 14:20 UTC, some authenticated users received a 500 response from POST /orders after adding a discounted item; requests from other users succeeded.” This wording exposes useful dimensions to compare.
- What did the user attempt?
- What result occurred instead?
- Who or what was affected?
- When did it begin, and is it still occurring?
🧊 Preserve Evidence Before It Expires
Logs rotate, traces expire, pods restart, caches change, and a retry can overwrite the evidence of the original failure. Capture identifiers and timestamps while they are still available.
Preserve request IDs, trace IDs, deployment identifiers, sanitized payload details, error messages, relevant feature-flag values, and the region or instance that served the request. Follow your organization’s privacy and security rules: production captures should not become a casual store of passwords, tokens, or personal data.
🧭 Build a Timeline Instead of Guessing
A timeline often turns an apparently random bug into a bounded event. Place releases, configuration edits, dependency incidents, traffic shifts, scheduled jobs, and the first observed failures on the same clock.
Correlation is not proof. A deploy near the failure may be unrelated, while a delayed cache refresh may be the real trigger. Still, timing tells you which changes deserve investigation before you edit code.
📊 Measure the Failure Boundary
Ask what separates failing events from successful ones. Do failures cluster by endpoint, customer plan, country, browser, payload size, application version, database shard, or worker instance?
A low error rate can still have a crisp boundary. For example, only accounts created before a migration may carry an old data shape. Looking at aggregate error rate alone hides that pattern.
🧪 Compare a Failed Request With a Successful Twin
The most productive unit of analysis is often a pair: one failing request and one nearly identical successful request. Compare them field by field, while redacting sensitive values.
| Dimension | Questions to compare |
|---|---|
| Input | Which fields, sizes, encodings, and optional values differ? |
| Identity | Do user role, tenant, account age, or permissions differ? |
| Execution | Did both reach the same service version, region, and downstream route? |
| State | Were cache entries, database records, or feature flags different? |
| Timing | Did a retry, timeout, concurrent request, or scheduled job overlap? |
This comparison produces hypotheses from evidence instead of assumptions.
🪪 Follow the Request With Correlation IDs
A correlation ID is a value carried through services so events from one user action can be connected. Distributed tracing systems often represent the same idea with trace and span IDs.
Follow the failing request from edge gateway to application service, queue, worker, database, and external provider. Find the first component that observed abnormal behavior. The final service reporting an error is not always the component that caused it.
🔭 Improve Observability at the Decision Point
Logs are most useful when they describe decisions, not merely failures. “Null pointer exception” tells you little; “discount rule selected without a currency for tenant A” tells you where to look.
Add structured fields around important branches: input category, chosen rule, feature-flag variant, dependency status, retry count, and sanitized entity identifier. Avoid logging every object by default. Excessive logs raise cost, obscure signals, and can expose sensitive information.
🧱 Inspect Production Configuration Carefully
Configuration is executable behavior in another form. Environment variables, secrets, feature flags, runtime limits, routing policies, and timeout values can change outcomes without a source-code deploy.
Compare effective configuration, not just configuration files in version control. A value may be overridden by the deployment platform, a regional setting, or an emergency change. Record both the value and where it came from.
🚩 Treat Feature Flags as Part of the Code Path
Feature flags frequently explain why one user fails while another succeeds. Flags may target a tenant, a percentage of traffic, a geography, an app version, or an internal cohort.
For each affected request, capture the flag evaluation result and rule that produced it. Do not assume “enabled” is enough: multivariate flags can select different implementations, and stale client-side flag state can create surprises.
🗃️ Examine Data Shape, Not Just Data Values
Production data has history. Records may predate a validation rule, contain partially completed migrations, reference deleted objects, or preserve states your test fixtures never create.
Consider a hypothetical profile record where older accounts have no preferred locale. New code assumes the field exists and only fails for those accounts. The value is not necessarily “bad”; the application’s assumption about its presence is incomplete.
🧬 Reproduce Production State Safely
When data is the likely factor, create a minimal sanitized fixture that keeps the relevant shape: missing fields, relationship counts, status values, or version markers. A small fixture is easier to share, test, and understand than a full production database copy.
If cloning data into a non-production environment is permitted, use approved masking and access controls. Never treat a lower environment as automatically safe for real customer information.
⏱️ Investigate Races and Timing Windows
Some failures require events to occur in a particular order. A user may submit twice, a background worker may update a record between reads, or a timeout may race with a late response.
These bugs are often absent locally because a laptop has different latency, concurrency, and load. Look for duplicate requests, overlapping trace spans, optimistic-lock conflicts, unexpected retry sequences, and state transitions that skip an expected step.
🔁 Understand Retries and Idempotency
Retries can hide a transient fault or create a second problem. If an operation is not idempotent—meaning repeated execution does not safely produce the same result—a network retry may create duplicate charges, messages, or records.
Log idempotency keys and attempt numbers. Then determine whether the first attempt completed downstream even though the caller timed out. A 500 response does not always mean no work occurred.
🌐 Check External Dependencies and Their Contracts
Your service may be healthy while a payment provider, identity service, DNS resolver, message broker, or storage API behaves differently in production. Examine dependency latency, status codes, error bodies, connection failures, and contract changes.
Do not immediately blame the dependency. Your client may be sending an edge-case payload, exhausting a connection pool, or interpreting a valid response incorrectly. The request trace should show what was sent, what returned, and how your code reacted.
🏗️ Compare Infrastructure, Regions, and Instances
Failures limited to one region or instance point toward infrastructure differences: an unhealthy node, missing certificate, stale image, local disk pressure, incorrect network policy, or uneven configuration rollout.
Tag telemetry with deployment version, zone, region, container image, and instance identity where practical. If all failures come from one subset of instances, removing that subset from service can be both a mitigation and a diagnostic test.
💾 Consider Caches, Queues, and Eventual Consistency
Production systems often trade immediate consistency for speed or resilience. A write may be accepted before a read replica, search index, cache, or downstream consumer reflects it.
Look for assumptions such as “a read immediately after a write must see the new value.” If that assumption is invalid, the fix might be a stronger consistency mechanism, a retry with clear limits, or a user experience that acknowledges processing is still underway.
🧵 Look for Resource Exhaustion and Load Effects
Production introduces resource limits that local development rarely reaches: connection pools, file descriptors, worker threads, memory, CPU, rate limits, and queue capacity. A service can appear normal at average load while failing at short spikes.
Inspect saturation signals alongside error timing. Elevated latency, long queue wait time, pool acquisition failures, garbage collection pressure, and throttling responses can reveal that the visible exception is a downstream effect of overload.
🧮 Verify Time, Time Zones, and Clock Assumptions
Time-related bugs emerge around daylight-saving changes, midnight boundaries, token expiration, scheduled jobs, and clocks that disagree. Local tests often use a convenient current time; production must process real calendars and distributed clocks.
Store and communicate timestamps with clear time zones, preferably UTC at system boundaries. For a suspected time bug, log the evaluated instant, the zone used for business rules, and the source of the clock.
🧑💻 Reproduce at the Right Fidelity Level
Local reproduction is valuable, but it is only one option. Choose the least risky environment that can test the hypothesis: unit test, integration environment, isolated production-like sandbox, canary deployment, or controlled replay.
High fidelity can reveal infrastructure-specific failures, but it also costs more and may increase risk. Start with the smallest experiment that distinguishes between competing explanations.
🧰 Use Production-Safe Diagnostic Techniques
Sometimes the only realistic reproduction environment is production. That does not mean experimenting recklessly on live users. Use guarded techniques: temporary targeted logs, read-only queries, a debug flag for one approved test account, shadow traffic, or a small canary cohort.
Every diagnostic change should have an owner, a rollback plan, a time limit, and a defined question it answers. “Add more logging” is not a question; “Does the failing request enter the fallback branch because field X is absent?” is.
🧪 Turn Each Hypothesis Into a Discriminating Test
A good hypothesis predicts evidence that would differ from alternatives. “It might be caching” is too broad. “Requests that fail use cache key version 1 after the schema deploy, while successful requests use version 2” can be tested.
- State the suspected mechanism.
- List the observation that would support or weaken it.
- Choose the safest way to obtain that observation.
- Record the outcome before moving on.
This discipline prevents an investigation from becoming a collection of memorable but unverified stories.
🛠️ Fix the Cause, Not the Symptom You First Saw
Once you identify a mechanism, ask why the system permitted it. A null check may stop the immediate crash, but it may leave invalid records, a broken migration, or an unclear contract untouched.
Robust fixes often include layers: validate inputs at boundaries, handle legitimate absence explicitly, migrate historical data when necessary, and expose enough telemetry to detect recurrence. The right scope depends on user impact and operational risk.
✅ Prove the Fix With a Regression Test
Convert the incident into an automated test whenever practical. The test should encode the essential condition, such as an old record shape, a concurrent update, a malformed-but-accepted payload, or a timeout followed by retry.
A regression test is valuable because the original context fades. Future maintainers may not remember why an unusual case matters, but a focused test preserves the behavior your system must support.
🚀 Roll Out With Verification Signals
A successful build does not prove a production fix. Release gradually when your platform and risk level allow it, then watch the exact signals that identified the defect: error category, affected cohort, latency, retry rate, or data integrity checks.
Define success and rollback conditions before deployment. If the error disappears but a related metric worsens, investigate rather than declaring victory based on a single dashboard.
📚 Write an Incident Record People Can Use
A useful incident record is not a blame document. It explains the customer impact, detection gap, technical mechanism, mitigation, permanent fix, and follow-up work.
Include the evidence that ruled out plausible alternatives. This helps future responders understand why the team chose a fix and often exposes systemic improvements, such as missing dashboards, unsafe defaults, incomplete runbooks, or weak test fixtures.
🧯 Avoid Common Debugging Traps
Several habits make elusive production bugs harder to solve:
- Changing many things at once: you lose the ability to tell which change mattered.
- Assuming logs are complete: absent evidence may mean absent instrumentation.
- Using production data casually: privacy and access boundaries still apply during incidents.
- Declaring a race condition without evidence: concurrency is plausible, not automatically proven.
- Closing the issue after errors stop: a transient recovery can mask an unresolved cause.
🤝 Make Debugging a Team Activity
Production incidents benefit from different perspectives. An application engineer may understand code paths, an operations engineer may spot rollout drift, and a support teammate may recognize a user workflow that telemetry does not show.
Assign clear roles when the incident is active: one person coordinates, one investigates, one handles communication, and one records decisions. This reduces duplicated work and protects the primary investigator from a stream of interruptions.
🏁 The Core Principle: Reduce Uncertainty Systematically
The central skill is not reproducing every production bug on a developer machine. It is reducing uncertainty with evidence until one explanation survives. Preserve the failing context, compare it with a successful case, inspect the execution path, and run small tests that distinguish among hypotheses.
Production is not merely a larger local environment. It has real history, real concurrency, distributed components, and operational constraints. Designing for observability and safe diagnosis turns that complexity from a mystery into information you can use.
When a production bug will not reproduce locally, debug the differences around the code—not just the code itself. That habit produces safer fixes, better systems, and calmer incident response. 🐞🔍🛠️