
A page that normally feels instant starts taking four seconds to load. A background job that used to finish before lunch now runs into the evening. A service looks healthy on dashboards, yet users report that checkout, search, or login has become frustratingly slow.
The first reaction is often broad and expensive: add servers, rewrite a service, replace a database, or optimize every suspicious-looking function. Sometimes those changes help. Often, they merely make the system more complicated while the real delay remains untouched.
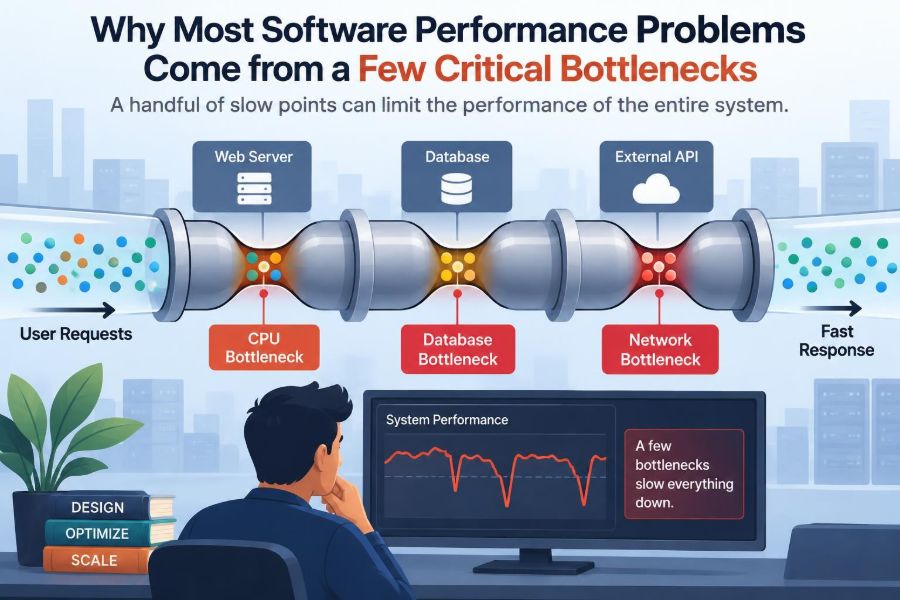
Most performance work has a more concentrated shape. A small number of operations, resources, or dependencies account for a large share of the waiting that users experience. Finding those critical bottlenecks is usually far more valuable than making hundreds of small improvements elsewhere.
That concentration matters whether you are tuning a personal project, maintaining a mature internal platform, or supporting a high-traffic product. Good performance engineering is less about guessing what is slow and more about tracing where time, capacity, and contention actually accumulate.
🎯 Performance Is Usually Unevenly Distributed
Software does not usually spend equal time in every part of its execution path. One database query may consume more time than dozens of application methods combined. One external API call may dominate an otherwise efficient request.
This is a practical version of the Pareto principle: a minority of components frequently creates a majority of observable delay. It is a pattern, not a fixed mathematical rule. The exact split varies by system, workload, and moment.
The useful implication is simple: treat performance as a measurement problem before treating it as an implementation problem.
⏱️ Users Experience the Slowest Part of the Journey
A user does not care that nine internal operations completed quickly if the tenth operation held the response for three seconds. Perceived latency is shaped by the critical path: the sequence of work that must finish before a result can be delivered.
Consider a product page that renders in 80 milliseconds but waits 1.5 seconds for inventory data. Improving rendering by 40 milliseconds is technically real, but it barely changes the experience. Reducing the inventory delay has a much larger effect.
This is why averages alone can be misleading. A request can have many fast pieces while still feeling slow because one required piece is consistently or occasionally late.
🧭 A Bottleneck Is More Than Slow Code
A bottleneck is the resource, operation, or dependency that limits how quickly useful work can move through a system. It may be a CPU-intensive algorithm, but it can also be a saturated connection pool, a locked database row, a congested network path, or a downstream service.
That distinction prevents a common mistake: reading “performance” as a synonym for “write faster code.” Efficient code matters, but code runs inside a system with queues, limits, shared resources, and dependencies.
A bottleneck may be hidden in configuration or architecture rather than in a visibly expensive line of source code.
🚦 Throughput and Latency Reveal Different Failures
Latency is the time required for one operation to finish. Throughput is the amount of work completed over a period, such as requests per second or jobs per minute. A system can have acceptable latency at low traffic yet fail to maintain throughput during a busy period.
When demand approaches the capacity of a constrained resource, queues grow. Requests then spend more time waiting, which raises latency even if the work itself has not become slower.
This is why a service may seem fine in a small test environment but degrade sharply under production-like concurrency.
📈 Queues Turn Small Delays Into Large Waits
Imagine one checkout lane serving customers at nearly the same rate that customers arrive. A brief slowdown creates a line. Once the line exists, each new customer waits not only for their own checkout but also for everyone ahead of them.
Software queues behave similarly: thread pools, message consumers, database connections, disk I/O, and rate-limited APIs all create places where work can wait. Near saturation, delay often grows much faster than traffic appears to justify.
Watching queue length, wait time, and utilization together is often more revealing than watching CPU usage alone.
🧵 The Critical Path Sets the Earliest Possible Finish
Some tasks can run in parallel; others cannot start until a prerequisite completes. The longest chain of required dependent work is the critical path. Its duration establishes the earliest possible completion time for that request or job.
Suppose an API request validates a token, reads a customer record, fetches pricing, and then writes an audit event. If the audit write can safely happen after the response, removing it from the synchronous path may improve user latency without making the audit operation faster.
Performance improvements are strongest when they shorten, remove, or overlap work on this path.
🔎 Measure Before You Optimize
Human intuition is poor at locating bottlenecks in systems with many layers. A function that looks computationally sophisticated may be insignificant beside a repeated network round trip. A “simple” query may be costly because it scans far more data than expected.
Start with an observable symptom and a representative workload. Then collect evidence from the relevant layers: request traces, application timing, database query data, runtime profiles, infrastructure metrics, and dependency timings.
Do not begin by changing code just because it feels likely to be slow. That can replace a known symptom with an unknown system.
🧪 Reproduce a Meaningful Workload
A useful measurement resembles the real situation. It includes realistic data volumes, request shapes, concurrency, cache state, and dependency behavior. A benchmark that repeatedly calls one method with tiny in-memory inputs may be valid for that method but irrelevant to end-to-end production performance.
Separate at least three conditions when possible:
- cold behavior, where caches and connections are not yet ready;
- steady-state behavior under ordinary load;
- stress behavior near expected peak concurrency.
Each condition can expose a different bottleneck. Treat synthetic tests as models with limits, not as complete replicas of reality.
📊 Use Percentiles Instead of Trusting the Average
An average response time can look acceptable while a meaningful group of requests is painfully slow. Percentiles describe the distribution: for example, a high percentile indicates how long slower requests take, excluding only the slowest tail beyond that point.
Averages remain useful for aggregate capacity planning, but users encounter individual requests. Looking at median behavior alongside higher-percentile latency helps distinguish a universally slow service from one that suffers intermittent stalls.
Also break results down by endpoint, tenant type, region, payload size, or operation. A blended metric can hide the workflow that needs attention.
🗺️ Distributed Tracing Connects the Waiting Time
In a distributed application, one request can cross gateways, services, queues, caches, and databases. Each team may see only its local component. Distributed tracing connects these steps into a timeline, often called a trace, using a shared request context.
A trace can show whether a slow request spent its time in application logic, waiting for a connection, retrying a remote call, or executing a database operation. It does not automatically explain why a span is slow, but it tells investigators where to look next.
Trace sampling needs care: rare failures can be missed if slow or error cases are not retained appropriately.
🗃️ Database Queries Are Frequent Choke Points
Databases sit on many critical paths and coordinate shared data, so they are natural concentration points for delay. A query may be slow because it reads too many rows, uses an unsuitable execution plan, sorts a large result set, waits on locks, or competes for constrained storage resources.
The right first step is usually to inspect the actual query, its parameters, and the database’s execution plan. An index that helps one query can add write cost and storage overhead, so indexing should follow demonstrated access patterns rather than habit.
Returning fewer columns and rows is often as valuable as making the query itself faster.
🔁 The N+1 Query Pattern Multiplies Small Costs
The N+1 pattern appears when code loads a collection with one query and then performs another query for each item in that collection. A page that displays 100 orders might quietly issue 101 queries instead of a small, planned set.
Each query may be fast in isolation. Together, they add network round trips, database parsing, connection use, and contention. The problem becomes more visible as the list grows.
Depending on the data model, solutions include joining or preloading related data, batching lookups, or changing the API to return exactly the data needed. Avoid indiscriminate eager loading, which can create a different expensive query.
🔒 Lock Contention Can Make Healthy Queries Wait
A query can be well indexed and still be slow because it is blocked by another transaction. Locks protect correctness when concurrent operations modify related data, but long transactions can force other work to wait.
Symptoms often include unpredictable latency: the same query is quick most of the time and slow during particular write-heavy periods. Looking only at query execution time may miss this because the dominant delay is waiting, not computation.
Keep transactions narrowly scoped, avoid interactive or remote work inside them, and understand the isolation behavior your database provides. Correctness requirements must guide any concurrency change.
🌐 Network Calls Add Latency and Uncertainty
A remote call has costs that local code does not: connection setup, routing, serialization, network travel, server processing, and response transfer. It also has more failure modes. A dependency can be slow, partially unavailable, or reachable only after retries.
Calling five services sequentially may turn modest individual delays into a slow endpoint. Parallelizing independent calls can shorten the critical path, but it can also increase downstream load and complicate failure handling.
Use explicit timeouts, sensible retry policies, and request budgets. Retrying without limits can amplify an outage by creating extra work precisely when a dependency is struggling.
🧊 Caching Changes Where the Bottleneck Lives
A cache stores reusable results closer to where they are needed. It can remove repeated database reads or remote calls, but it does not make data permanently free. Cache misses, expiration, invalidation, and memory limits all shape its behavior.
A common failure is the cache stampede: many requests miss the same key and simultaneously rebuild an expensive value. Techniques such as request coalescing, controlled refresh, jittered expiration, or stale-while-revalidate behavior can reduce this burst.
Cache only when the freshness, consistency, and invalidation trade-offs are acceptable. A cache is a design decision, not a universal performance patch.
🧮 Algorithms Matter When Data Grows
An inefficient algorithm may look harmless on a development dataset and become dominant when records, users, or events increase. Repeated linear searches inside a loop, unnecessary sorting, and nested comparisons are classic examples.
Big-O notation describes how work grows with input size, but it is not a stopwatch. Constant factors, allocations, I/O, and real data shape actual timing. Still, growth analysis is valuable because it identifies work that will eventually become disproportionate.
Before replacing an algorithm, measure the realistic input range. A more sophisticated structure can add complexity without helping small workloads.
🧠 CPU Bottlenecks Need Profiles, Not Guesswork
CPU-bound problems include expensive parsing, compression, encryption, image processing, serialization, and repeated computation. A profiler samples or instruments execution to show where CPU time is being spent.
Profiles often expose surprises: framework overhead, regular expressions on large input, allocation-heavy transformations, or logging performed on hot paths. Optimize the largest confirmed consumers first, then profile again.
CPU utilization should be interpreted in context. High CPU can mean useful work, inefficient work, or too little parallel capacity. Low CPU does not mean a request is fast; it may be waiting elsewhere.
🗑️ Allocation and Garbage Collection Can Cause Pauses
Managed runtimes automatically reclaim memory, which simplifies programming but does not eliminate memory performance concerns. Rapid allocation of short-lived objects can increase garbage-collection activity; retained objects can increase memory pressure and collection cost.
Warning signs include rising heap use, frequent collections, allocation-heavy hot paths, or latency spikes that correlate with runtime pauses. The remedy might be reducing unnecessary temporary objects, fixing an unintended retention path, or adjusting runtime settings after careful testing.
Do not prematurely pool every object. Pools can retain memory, introduce synchronization costs, and make code harder to reason about.
🧵 Thread Pools and Connection Pools Create Hidden Queues
Thread pools limit concurrent execution so a service does not create unlimited threads. Connection pools do the same for databases and remote resources. These limits are essential, but a pool that is too small, too large, or consumed by slow work becomes a bottleneck.
If all database connections are busy, new requests wait even if the application has spare CPU. If worker threads block on remote I/O, queued tasks can accumulate behind them.
Measure pool utilization, acquisition wait time, active work, and queue depth. Increasing a limit may simply push overload into the next shared component, especially a database.
📦 Serialization and Payload Size Have Real Costs
Large JSON documents, verbose headers, oversized images, and unnecessary fields consume CPU, memory, bandwidth, and time. They can also create downstream parsing work and increase tail latency on slower client connections.
Design responses around the consumer’s actual needs. Pagination, field selection, compression where appropriate, and efficient binary formats for suitable internal paths can help. The best option depends on interoperability, debugging needs, and client constraints.
Do not optimize wire formats blindly. A small payload reduction is less valuable than eliminating a blocking dependency, but payload costs become significant on high-volume or mobile-facing paths.
📁 Disk and Storage Limits Still Matter
Storage bottlenecks appear in database reads and writes, log-heavy services, file processing, backups, and build systems. Random access patterns, synchronous writes, constrained I/O capacity, and competing workloads can all raise latency.
Excessive logging is a practical example. Detailed logs are valuable during investigation, but writing huge volumes synchronously on a hot path can consume CPU and I/O while making important events harder to find.
Measure storage wait and throughput alongside application metrics. Moving a workload to faster storage may help, but reducing needless reads or writes can be more durable.
⚖️ Contention Is Often the Real Shared Resource Problem
Contention occurs when multiple operations compete for something that cannot serve them all at once: a mutex, a hot database row, a cache key, a single queue partition, or a shared file. The work may be individually fast, yet aggregate performance suffers because operations serialize.
For example, a global lock around a frequently updated in-memory map may be invisible in single-user testing. Under concurrency, waiting for that lock can dominate execution time.
Partitioning data, reducing shared mutable state, shortening critical sections, or choosing an appropriate concurrent structure can help. These changes require careful correctness testing because concurrency bugs are subtle.
📬 Asynchronous Work Can Shorten a User-Facing Path
Not every action must complete before a user receives confirmation. Sending a noncritical notification, generating an analytics event, or producing a report preview may be moved to a queue or background worker when the product’s consistency requirements allow it.
This changes the experience from “wait until all work is done” to “acknowledge essential work, then finish follow-up work reliably.” It can remove expensive operations from a synchronous critical path.
Asynchrony is not a free speed boost. It introduces eventual consistency, retry design, duplicate delivery, monitoring needs, and a requirement to handle failed jobs safely.
🧯 Timeouts, Backpressure, and Load Shedding Protect Capacity
When a dependency slows down, accepting unlimited work usually makes matters worse. Queues grow, memory rises, worker pools fill, and healthy requests may be trapped behind unhealthy ones.
Backpressure means signaling or enforcing that a component cannot accept more work at the current rate. It may involve bounded queues, rate limits, concurrency limits, or rejecting nonessential requests. Load shedding deliberately declines some work to preserve core operations.
These techniques trade completeness for stability during overload. The correct policy depends on which operations are essential and what users can safely retry later.
🧱 Scaling Helps Only When It Addresses the Constraint
Adding application instances can increase capacity when stateless application CPU is the limiting resource. It does little for a single overloaded database, a serial critical section, or an external service with its own strict limits.
Horizontal scaling may even worsen a database bottleneck by increasing concurrent connection attempts and query volume. Vertical scaling can provide headroom, but it may postpone rather than remove a structural constraint.
Ask a precise question before scaling: which resource is saturated, and will this change reduce its work or increase its capacity?
🛠️ A Practical Bottleneck Investigation Loop
Performance work benefits from a disciplined loop that keeps changes small and evidence-based:
- Define the affected user journey and the metric that represents it.
- Capture a baseline under a representative workload.
- Identify the largest source of time, waiting, or saturation.
- Form a specific hypothesis about the cause.
- Make one targeted change and test the same scenario.
- Compare results, check for regressions, and repeat if needed.
Keep a record of conditions and results. Without a baseline, it is easy to mistake normal variation for an improvement.
🚫 Common Optimizations That Miss the Point
Several habits consume effort without reliably improving the user experience. Micro-optimizing a rarely used helper, replacing readable code with clever code, increasing every pool size, and caching without an invalidation plan are familiar examples.
Another mistake is fixing only the average. A change that improves common requests while making rare but business-critical requests much worse may be a regression.
Readable code, clear ownership, and good observability are performance tools too. They make future bottlenecks easier to locate and safer to change.
✅ Validate the Whole System After a Fix
A bottleneck fix can move pressure elsewhere. Batching database writes may reduce query count but increase lock duration. Parallel requests may reduce one endpoint’s latency while overwhelming a downstream service. Caching may lower reads but expose stale-data edge cases.
After an improvement, recheck end-to-end latency, error rates, resource use, queue behavior, and correctness under expected concurrency. Watch the previously constrained component and the components immediately around it.
A successful change is not merely faster in isolation; it remains reliable and understandable in the operating environment.
🧭 Build Observability Into Normal Engineering
Teams find bottlenecks faster when important paths already expose useful signals: request IDs, durations, dependency calls, error categories, queue depth, pool waits, and resource saturation. This is observability: designing systems so their internal behavior can be inferred from their outputs and telemetry.
Choose a modest set of metrics connected to user outcomes rather than collecting everything. Instrumentation itself has cost, and noisy dashboards can obscure rather than clarify a problem.
During design reviews, ask which operation is likely to become shared, slow, or capacity-limited as usage grows. That question often prevents a future blind spot.
🏁 The Core Principle: Find the Constraint That Governs the Outcome
Most performance problems feel larger than they are because users see the entire slow system, while engineers initially see many possible causes. The investigation becomes manageable when it focuses on the limiting step in a concrete journey.
That step may change over time. After a query is improved, a remote call may become dominant. After a cache is added, invalidation or connection capacity may become the next constraint. Performance tuning is therefore iterative rather than a one-time cleanup.
The durable skill is not memorizing a list of tricks. It is learning to connect user-visible delay to measured work, waiting, and saturation, then improving the factor that currently matters most.
The highest-leverage performance improvement is usually the one that removes or relieves the bottleneck on the critical path, not the one that makes the most code look faster. Measure carefully, change deliberately, and let the system show you where the next constraint lies. ⚙️📈🔍