
A payment screen spins just as a customer is trying to check out. A developer cannot deploy because the build service is unavailable. A hospital scheduling portal is slow enough that staff switch to phone calls. In each case, the software may still exist, but it is not delivering the service people need at that moment.
Teams often describe these events with a simple phrase: “the system was down.” Yet downtime is rarely as simple as a binary switch. A service can be unreachable, painfully slow, returning incorrect results, or available only to some users in one region.
Availability gives teams a shared way to quantify that experience over time. It turns an operational feeling—“we seem to have too many incidents”—into a measure that can guide architecture, priorities, communication, and investment.
The formula is straightforward. Using it well requires careful definitions: what counts as service, whose experience counts, when the measurement clock runs, and what trade-offs are acceptable.
🧭 Availability in Plain Language
Availability is the proportion of a defined period during which a system can perform its intended function for its intended users. It is usually expressed as a percentage.
A web application that responds successfully for nearly all of a month is highly available. But “responds” must mean more than a network connection. If an online store returns a page while every checkout attempt fails, users reasonably experience the store as unavailable.
Availability is therefore a service outcome, not merely a server state. The definition should reflect the meaningful action a user or dependent system needs to complete.
➗ The Core Availability Formula
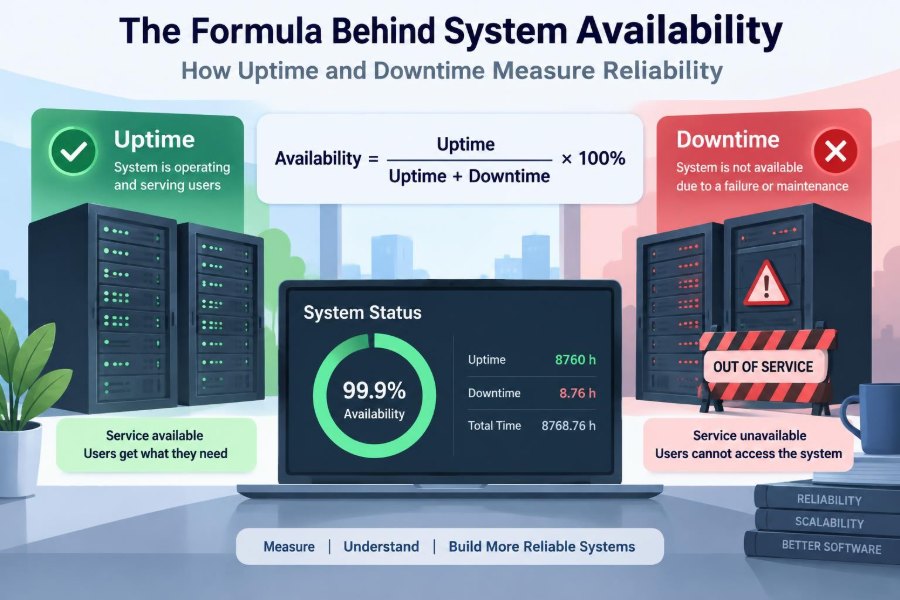
The basic formula is:
Availability = Uptime / (Uptime + Downtime) × 100%The denominator is the total measured time. If a service is usable for 719 hours and unavailable for 1 hour in a 720-hour measurement period, its availability is 719 divided by 720, or about 99.86%.
The same equation can be written as 1 − Downtime / Total Time. This version is often helpful during incident reviews because it shows exactly how much of the reporting period was lost.
⏱️ What Uptime Actually Means
Uptime is not simply the time a process is running. It is the time during which the agreed service works within its stated conditions.
For an API, uptime might require successful responses to authenticated requests within a latency threshold. For a data warehouse, it may mean scheduled queries and ingestion jobs complete correctly. For a messaging platform, it may mean users can send and receive messages without unacceptable delay.
Defining uptime around outcomes prevents a misleading metric in which healthy-looking infrastructure masks a broken product capability.
🛑 What Counts as Downtime
Downtime is time during which the service fails the availability definition. A total outage is the clearest case, but partial failure can also be downtime when it prevents the intended task.
Examples include an expired certificate that blocks all clients, a database overload that makes requests time out, or a software release that causes payment authorizations to fail. Data corruption is also a serious service failure even if every endpoint returns a fast response.
Teams should decide whether degraded performance counts fully, partially, or separately. The choice must be explicit before an incident occurs.
📐 The Measurement Window Changes the Story
Availability always needs a time window: an hour, a rolling 30 days, a calendar month, or a year. The same outage looks different across windows.
A 30-minute outage dominates a one-hour window but has a smaller numerical effect across a year. Neither view is wrong. A short window reveals immediate operational impact; a longer window shows cumulative reliability.
Use reporting periods that match decisions. On-call teams need near-real-time views, while service commitments and capacity planning commonly use monthly or quarterly views.
🔢 Why “Nines” Matter
Availability targets are often described as “nines.” A 99.9% target is called three nines; 99.99% is four nines. The visual difference is one extra 9, but the permitted failure time shrinks dramatically.
| Target availability | Maximum downtime in a 30-day period | Maximum downtime in a 365-day period |
|---|---|---|
| 99% | About 7 hours 12 minutes | About 3 days 15 hours |
| 99.9% | About 43 minutes | About 8 hours 46 minutes |
| 99.99% | About 4 minutes 19 seconds | About 53 minutes |
| 99.999% | About 26 seconds | About 5 minutes 15 seconds |
These are mathematical budgets, not promises that every user will have an identical experience. They also assume the entire period is included in measurement.
💸 Higher Availability Has a Real Cost
Moving from three nines to four nines may require redundant components, automated failover, tested recovery procedures, stronger monitoring, safer deployment methods, and more operational staffing. The cost is technical, financial, and organizational.
Not every feature deserves the same target. A payroll submission system near a filing deadline may justify rigorous resilience. An internal report generator used once each week may not. Good reliability engineering matches the protection level to the consequence of failure.
🎯 Start With the User Journey
Infrastructure metrics are useful diagnostics, but availability should begin with a user journey. Ask: what is the smallest meaningful transaction?
For a shopping service, it could be “a customer can submit an order and receive confirmation.” For a learning platform, it might be “a student can open assigned material.” For an identity service, it could be “an authorized user can sign in.”
This approach catches failures that host-level checks miss, such as a broken dependency, invalid authorization policy, or unusable front-end flow.
🩺 Health Checks Are Not Availability Checks
A health check is a request used to assess whether a component appears capable of serving traffic. It is essential for load balancers and orchestration systems, but a shallow health check can return success while the product is failing.
For example, a /health endpoint may confirm that a web process is alive without testing its database, queue, payment provider, or core business rule. Making health checks too deep, however, can create load or cause one dependent failure to remove otherwise useful capacity.
Use component checks for routing decisions and separate synthetic user transactions for service availability.
🌍 Availability Is Not the Same for Every User
A service may work from one cloud region and fail from another. Desktop users may succeed while mobile users encounter a rendering defect. One customer tier may be affected by a faulty configuration while others are untouched.
Aggregate availability can hide these differences. Segment measurement by meaningful dimensions such as region, client type, API operation, tenant, or release version when the service architecture and privacy rules allow it.
The aim is not endless metric slicing. It is detecting whether the headline number reflects a localized but severe customer problem.
🐢 Performance Can Become an Availability Failure
Users rarely care whether a request eventually succeeds after an unreasonable wait. That is why many availability definitions include a response-time threshold.
Suppose an account dashboard returns HTTP success but needs 90 seconds to load during peak traffic. Technically counting every response as available would overstate the delivered service. A better rule might require both correct results and completion below an agreed latency limit.
This does not mean all slow requests are outages. It means the threshold should be based on the task, user expectations, and the impact of delay.
✅ Correctness Belongs in the Conversation
A system can be fast, reachable, and wrong. An inventory service that reports products as available when they are not creates operational damage despite excellent network-level uptime.
Availability metrics cannot fully capture every quality dimension, but key correctness checks should be included in critical journeys. Examples include confirming that an order is persisted, a transfer is recorded once, or an access policy is enforced.
Pair availability with domain-specific integrity measures rather than treating a successful HTTP status as proof of a successful service.
🧩 Dependencies Set Practical Limits
Modern applications depend on databases, DNS, identity providers, third-party APIs, message brokers, and cloud services. A dependency failure can make the user-facing product unavailable even if its own servers remain healthy.
For services in a strict series path, availability compounds. If a request requires two independent components, each available 99.9% of the time, the combined path is roughly 99.8% available before considering other failure modes.
This is why dependency mapping matters. It reveals where redundancy, caching, graceful degradation, or alternative workflows are most valuable.
🪢 Shared Dependencies Create Correlated Failures
Redundancy only helps when the redundant paths do not fail for the same reason. Two application instances in one availability zone can both disappear during a zone-wide event. Two providers may still rely on the same DNS configuration or identity system.
Correlated failure occurs when supposedly separate components share a hidden common cause. A bad deployment, common credential, shared control plane, or identical software defect can create this pattern.
Design reviews should ask not only “what is duplicated?” but also “what could take both copies down together?”
🔄 Redundancy Improves Recovery Options
Redundancy provides alternative capacity or paths when a component fails. Common patterns include multiple application instances, replicated data stores, geographically separated regions, and queues that absorb temporary downstream failures.
It is not automatically beneficial. Replication introduces consistency decisions, failover adds complexity, and extra components create more things to operate. A poorly tested failover path can fail precisely when it is needed.
Choose redundancy based on a concrete failure scenario and test it under controlled conditions.
🧯 Graceful Degradation Preserves the Core
When a nonessential feature fails, the whole product need not fail with it. Graceful degradation means preserving the most valuable function while reducing optional behavior.
A retail site might temporarily hide personalized recommendations while keeping search and checkout available. An analytics dashboard might show slightly stale data while ingestion recovers. These choices must be safe: never use degradation to conceal uncertainty in balances, permissions, or transaction results.
Explicit fallback behavior can protect availability by preventing a weak dependency from blocking the critical path.
📊 Monitoring Measures, Alerting Mobilizes
Monitoring collects observations; alerting asks people to act. Conflating them leads either to blind spots or to noisy alerts that responders learn to ignore.
Monitor user-facing success rate, latency, errors, saturation, dependency state, and deployment changes. Alert on sustained conditions that require timely intervention, preferably based on symptoms that users actually experience.
A dashboard that looks impressive after an outage is less useful than an alert that identifies a failing checkout journey while there is still time to reduce harm.
🧪 Synthetic Monitoring Tests From the Outside
Synthetic monitoring uses automated probes to perform predefined actions, such as logging in, searching, or submitting a harmless test transaction. Because probes run regularly, they can detect failures before many users report them.
They have limits. Test accounts may not represent real permissions, test data may bypass complicated production paths, and a probe from one location cannot describe every user’s experience.
Use synthetics alongside real-user telemetry. Together, they show both whether a known journey works and how actual traffic is behaving.
👥 Real-User Monitoring Adds Context
Real-user monitoring derives signals from actual client interactions, often including page-load timing, errors, and completion events. It can reveal browser-specific issues, regional slowness, and journeys that synthetic tests did not model.
Its data needs thoughtful handling. Avoid collecting sensitive values unnecessarily, apply privacy and retention controls, and remember that low traffic can make percentages unstable.
For availability, real-user data is especially valuable when a system is partially impaired rather than completely unreachable.
🧾 Planned Maintenance Needs a Clear Policy
Some organizations exclude approved maintenance from availability calculations; others include it because users still lose access. Neither policy is inherently correct, but silently changing the rule makes the metric untrustworthy.
Modern deployment practices can reduce maintenance disruption through rolling updates, backward-compatible database changes, and traffic shifting. Still, some operations require restricted access or brief interruption.
Document whether planned maintenance consumes the availability budget, how customers are notified, and who can approve an exception.
📜 SLIs, SLOs, and SLAs Serve Different Purposes
An SLI, or service level indicator, is the measured quantity: for example, the percentage of valid requests completed under a chosen latency threshold. An SLO, or service level objective, is the target for that indicator.
An SLA, or service level agreement, is a contractual or formal commitment that may specify remedies when a service level is missed. An SLA should be written carefully; it is not just an ambitious dashboard target.
Teams often use internal SLOs that are stricter than external commitments, leaving time to detect and correct problems before contractual thresholds are at risk.
💳 Error Budgets Turn Targets Into Decisions
An error budget is the permitted amount of unreliability implied by an SLO. With a 99.9% monthly objective, roughly 0.1% of the measurement opportunity is available for failures.
This framing helps balance reliability with delivery speed. If a team has consumed little budget, it may accept more release experimentation. If repeated incidents consume most of it, the sensible priority is stabilization: fix failure modes, improve tests, reduce risky changes, or slow release cadence.
An error budget is not permission to cause outages. It is a transparent mechanism for making trade-offs before pressure forces impulsive decisions.
🧮 Weighting Requests Requires Care
Request-based availability counts successful eligible requests divided by all eligible requests. It is often practical for high-volume APIs, but a million trivial reads can overwhelm the significance of a small number of failed high-value transactions.
Time-based availability measures how long a service is in or out of compliance. It reflects duration but may understate a short, high-volume failure. Transaction-based measures focus on completed user tasks.
Choose the method that best represents harm. Critical workflows may need their own SLI rather than being averaged into a broad platform number.
🧠 Mean Time Metrics Explain Different Things
Availability is related to, but different from, common reliability measures. MTTR means mean time to repair or restore; lower MTTR generally reduces downtime. MTBF means mean time between failures; it describes the spacing of failures under a defined interpretation.
A simplified model sometimes expresses availability as:
Availability ≈ MTBF / (MTBF + MTTR)This is useful for intuition, not a complete description of complex distributed systems. Failures are not always independent, repair time varies, and partial outages do not fit neatly into one average.
🚀 Deployments Are a Frequent Reliability Moment
Change is necessary, but deployments are a common point where latent assumptions meet production traffic. Safer delivery reduces blast radius rather than pretending every release will be defect-free.
- Use small, reversible changes where possible.
- Shift traffic gradually with canary or phased releases.
- Watch user-facing SLIs during and after rollout.
- Prepare rollback or forward-fix steps before deployment.
- Make database changes compatible across old and new application versions.
Release speed and availability are not opposites when teams invest in observability, automation, and recovery discipline.
🔍 Incident Reviews Improve the Next Measurement
After an incident, calculate impact using the established availability definition, but do not stop at the number. Investigate detection, diagnosis, mitigation, communication, and recovery.
A useful review asks what conditions allowed the failure, which safeguards worked, which signals arrived too late, and what changes will reduce recurrence or shorten restoration. The goal is learning, not assigning blame to an individual.
Incident reviews often improve the metric itself by exposing ambiguous definitions, missing synthetic checks, or customer journeys that were never measured.
⚠️ Common Availability Measurement Mistakes
Several shortcuts produce reassuring but weak numbers:
- Counting a running process as a functioning service.
- Ignoring latency and correctness in a success definition.
- Measuring only from inside the same network as the application.
- Excluding inconvenient incidents without a documented policy.
- Averaging unrelated services into one headline figure.
- Using a long reporting window to obscure recurring short failures.
The fix is not a perfect universal metric. It is a published definition that captures a meaningful service promise and can be consistently audited.
🛠️ A Practical Way to Build an Availability Program
Start small with one critical journey and improve from evidence. A workable sequence is:
- Name the user action that must work.
- Define success, including correctness and any relevant latency boundary.
- Choose the measurement source and reporting window.
- Set an achievable objective based on user impact and operational capability.
- Create dashboards and alerts tied to the indicator.
- Review incidents and adjust architecture, runbooks, or definitions when learning warrants it.
Do not begin by selecting a fashionable number of nines. Begin by understanding what failure costs users and what engineering controls can realistically prevent or contain.
🏁 The Core Principle Behind Reliable Service
Availability is the fraction of time—or, for some indicators, the fraction of meaningful opportunities—in which a service delivers what it promised. The formula is simple because its job is to summarize; the careful work lies in defining the promise.
Useful availability metrics are user-centered, explicit about scope, sensitive to partial failures, and connected to action. They help teams decide where to add resilience, when to pause risky change, and whether recovery is getting faster.
Chasing a percentage in isolation can encourage cosmetic reporting. Measuring a real service outcome turns uptime and downtime into a practical feedback loop for reliability.
System availability is most valuable when it measures the experience people depend on, not merely the components that happen to be running. Build the definition around that experience, then use every incident and release to make it more dependable. ⚙️📈🛡️