
Context diagram
The context diagram is the most abstract data flow representation of a system. It represents the entire system as a single bubble. This bubble is labeled according to the main function of the system. The various external entities with which the system interacts and the data flow occurring between the system and the external entities are also represented. The data input to the system and the data output from the system are represented as incoming and outgoing arrows. These data flow arrows should be annotated with the corresponding data names. The name ‘context diagram’ is well justified because it represents the context in which the system is to exist, i.e. the external entities who would interact with the system and the specific data items they would be supplying the system and the data items they would be receiving from the system. The context diagram is also called as the level 0 DFD.
To develop the context diagram of the system, it is required to analyze the SRS document to identify the different types of users who would be using the system and the kinds of data they would be inputting to the system and the data they would be receiving the system. Here, the term “users of the system” also includes the external systems which supply data to or receive data from the system.
The bubble in the context diagram is annotated with the name of the software system being developed (usually a noun). This is in contrast with the bubbles in all other levels which are annotated with verbs. This is expected since the purpose of the context diagram is to capture the context of the system rather than its functionality.
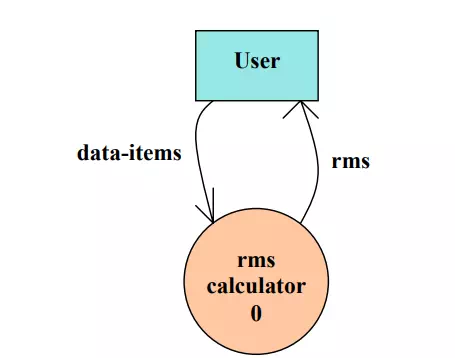
Example: RMS Calculating Software.
A software system called RMS calculating software would read three integral numbers from the user in the range of -1000 and +1000 and then determine the root mean square (rms) of the three input numbers and display it. In this example, the context diagram is simple to draw. The system accepts three integers from the user and returns the result to him.
Context Diagram
Example: Tic-Tac-Toe Computer Game
DFD model of a system
A DFD model of a system graphically depicts the transformation of the data input to the system to the final result through a hierarchy of levels. A DFD starts with the most abstract definition of the system (lowest level) and at each higher level DFD, more details are successively introduced. To develop a higher-level DFD model, processes are decomposed into their sub-processes and the data flow among these sub-processes is identified.
To develop the data flow model of a system, first the most abstract representation of the problem is to be worked out. The most abstract representation of the problem is also called the context diagram. After, developing the context diagram, the higher-level DFDs have to be developed.
Context Diagram:-
This has been described earlier.
Level 1 DFD:-
To develop the level 1 DFD, examine the high-level functional requirements. If there are between 3 to 7 high-level functional requirements, then these can be directly represented as bubbles in the level 1 DFD. We can then examine the input data to these functions and the data output by these functions and represent them appropriately in the diagram.
If a system has more than 7 high-level functional requirements, then some of the related requirements have to be combined and represented in the form of a bubble in the level 1 DFD. Such a bubble can be split in the lower DFD levels. If a system has less than three high-level functional requirements, then some of them need to be split into their sub-functions so that we have roughly about 5 to 7 bubbles on the diagram.
Decomposition:-
Each bubble in the DFD represents a function performed by the system. The bubbles are decomposed into sub-functions at the successive levels of the DFD. Decomposition of a bubble is also known as factoring or exploding a bubble. Each bubble at any level of DFD is usually decomposed to anything between 3 to 7 bubbles. Too few bubbles at any level make that level superfluous. For example, if a bubble is decomposed to just one bubble or two bubbles, then this decomposition becomes redundant. Also, too many bubbles, i.e. more than 7 bubbles at any level of a DFD makes the DFD model hard to understand. Decomposition of a bubble should be carried on until a level is reached at which the function of the bubble can be described using a simple algorithm.
Numbering of Bubbles:-
It is necessary to number the different bubbles occurring in the DFD. These numbers help in uniquely identifying any bubble in the DFD by its bubble number. The bubble at the context level is usually assigned the number 0 to indicate that it is the 0 level DFD. Bubbles at level 1 are numbered, 0.1, 0.2, 0.3, etc, etc. When a bubble numbered x is decomposed, its children bubble are numbered x.1, x.2, x.3, etc. In this numbering scheme, by looking at the number of a bubble we can unambiguously determine its level, its ancestors, and its successors.
Example:-
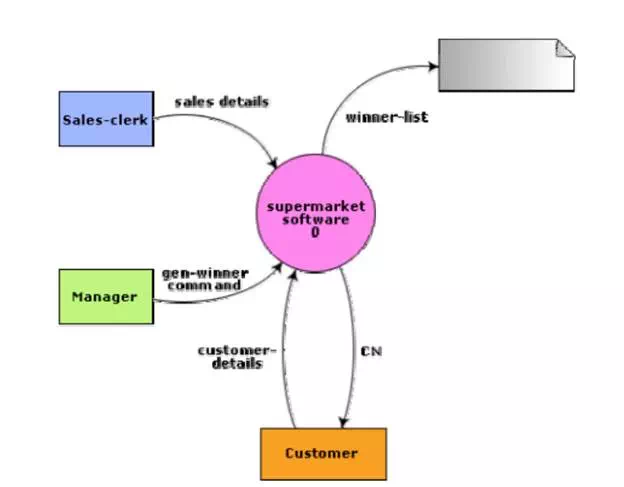
A supermarket needs to develop the following software to encourage regular customers. For this, the customer needs to supply his/her residence address, telephone number, and the driving license number. Each customer who registers for this scheme is assigned a unique customer number (CN) by the computer. A customer can present his CN to the checkout staff when he makes any purchase. In this case, the value of his purchase is credited against his CN. At the end of each year, the supermarket intends to award surprise gifts to 10 customers who make the highest total purchase over the year. Also, it intends to award a 22-caret gold coin to every customer whose purchase exceeded Rs.10,000. The entries against the CN are the reset on the day of every year after the prize winners’ lists are generated.
Context diagram for supermarket problem
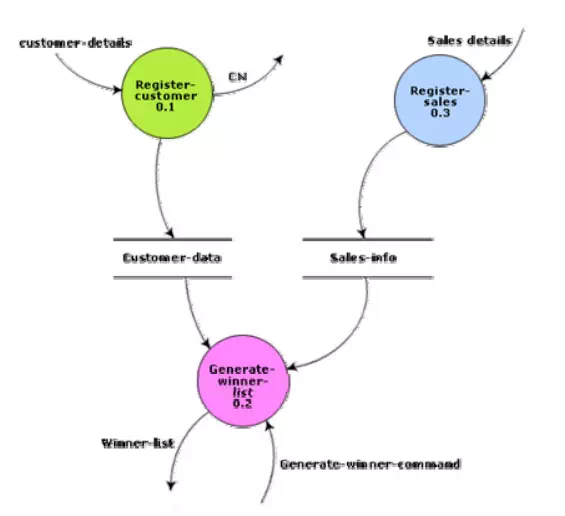
Level 1 diagram for supermarket problem
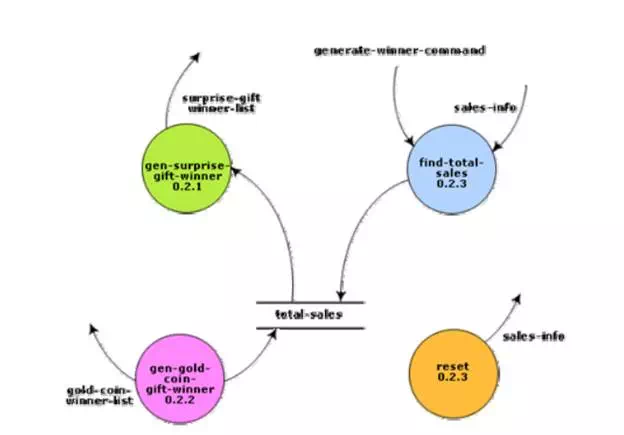
Level 2 diagram for supermarket problem
Data dictionary for a DFD model
Every DFD model of a system must be accompanied by a data dictionary. A data dictionary lists all data items appearing in the DFD model of a system. The data items listed include all data flows and the contents of all data stores appearing on the DFDs in the DFD model of a system. We can understand the creation of a data dictionary better by considering an example.
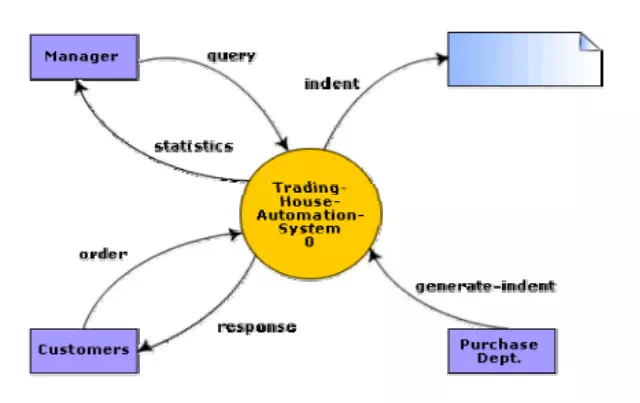
Example: Trading-House Automation System (TAS).
The trading house wants us to develop a computerized system that would automate various book-keeping activities associated with its business. The following are the salient features of the system to be developed:
• The trading house has a set of regular customers. The customers place orders with it for various kinds of commodities. The trading house maintains the names and addresses of its regular customers. Each of these regular customers should be assigned a unique customer identification number (CIN) by the computer. The customers quote their CIN on every order they place.
• Once order is placed, as per current practice, the accounts department of the trading house first checks the credit-worthiness of the customer. The credit-worthiness of the customer is determined by analyzing the history of his payments to different bills sent to him in the past. After automation, this task has to be done by the computer.
• If the customer is not credit-worthy, his orders are not processed any further and an appropriate order rejection message is generated for the customer.
• If a customer is credit-worthy, the items that have been ordered are checked against a list of items that the trading house deals with. The items in the order which the trading house does not deal with, are not processed any further and an appropriate apology message for the customer for these items is generated.
• The items in the customer’s order that the trading house deals with are checked for availability in the inventory. If the items are available in the inventory in the desired quantity, then
· A bill with the forwarding address of the customer is printed.
· A material issue slip is printed. The customer can produce this material issue slip at the store house and take delivery of the items.
· Inventory data is adjusted to reflect the sale to the customer.
• If any of the ordered items are not available in the inventory in sufficient quantity to satisfy the order, then these out-of-stock items along with the quantity ordered by the customer and the CIN are stored in a “pending-order” file for the further processing to be carried out when the purchase department issues the “generate indent” command.
• The purchase department should be allowed to periodically issue commands to generate indents. When a command to generate indents is issued, the system should examine the “pending-order” file to determine the orders that are pending and determine the total quantity required for each of the items. It should find out the addresses of the vendors who supply these items by examining a file containing vendor details and then should print out indents to these vendors.
• The system should also answer managerial queries regarding the statistics of different items sold over any given period of time and the corresponding quantity sold and the price realized.
Context diagram for TAS
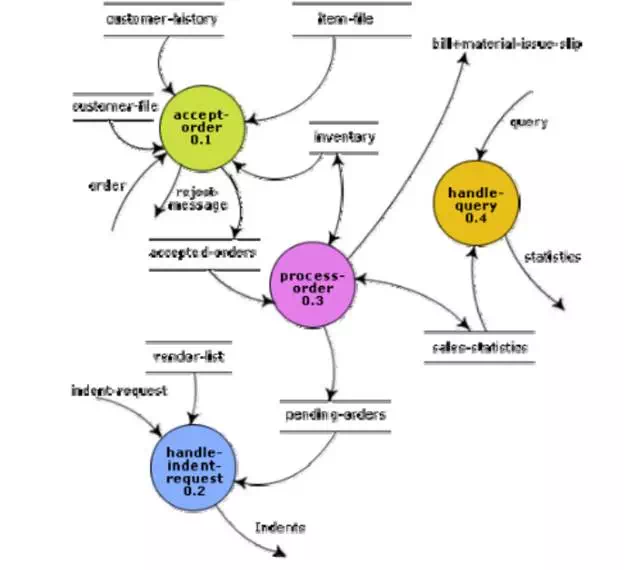
Level 1 DFD for TAS
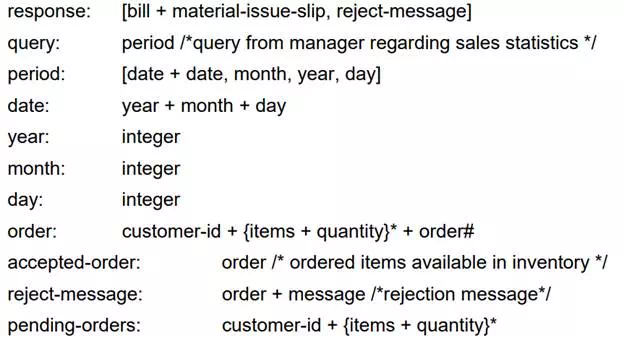
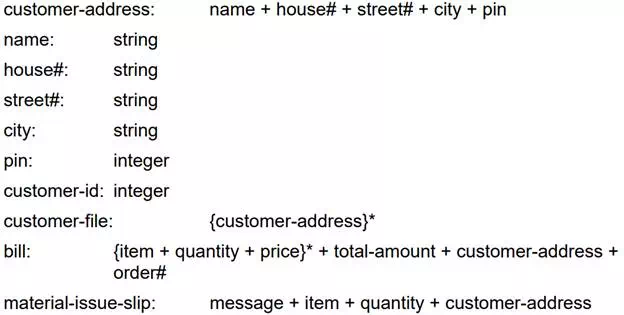
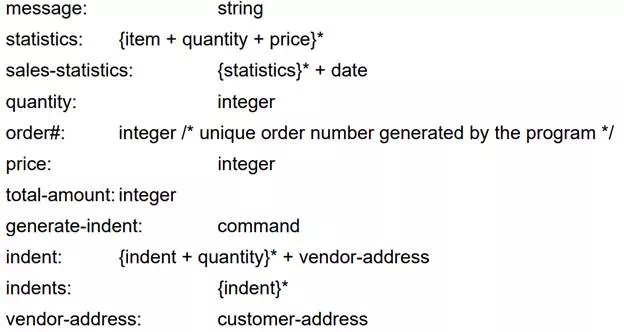
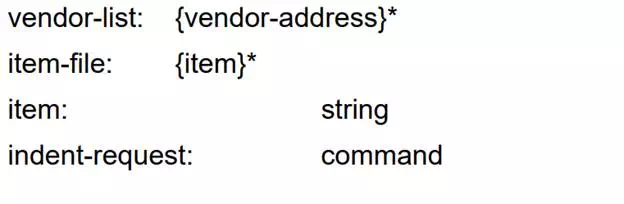
Data Dictionary for the DFD Model of TAS:
Commonly made errors while constructing a DFD model
Although DFDs are simple to understand and draw, students and practitioners alike encounter similar types of problems while modelling software problems using DFDs. While learning from experience is powerful thing, it is an expensive pedagogical technique in the business world. It is therefore helpful to understand the different types of mistakes that users usually make while constructing the DFD model of systems.
• Many beginners commit the mistake of drawing more than one bubble in the context diagram. A context diagram should depict the system as a single bubble.
• Many beginners have external entities appearing at all levels of DFDs. All external entities interacting with the system should be represented only in the context diagram. The external entities should not appear at other levels of the DFD.
• It is a common oversight to have either too less or too many bubbles in a DFD. Only 3 to 7 bubbles per diagram should be allowed, i.e. each bubble should be decomposed to between 3 and 7 bubbles.
• Many beginners leave different levels of DFD unbalanced.
• A common mistake committed by many beginners while developing a DFD model is attempting to represent control information in a DFD. It is important to realize that a DFD is the data flow representation of a system, and it does not represent control information. For an example mistake of this kind:
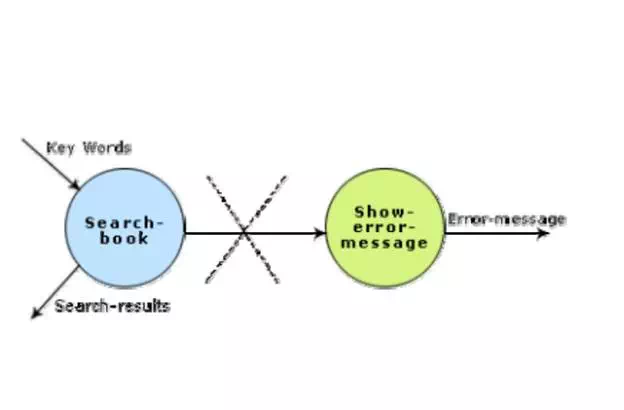
· Consider the following example. A book can be searched in the library catalog by inputting its name. If the book is available in the library, then the details of the book are displayed. If the book is not listed in the catalog, then an error message is generated. While generating the DFD model for this simple problem, many beginners commit the mistake of drawing an arrow (as shown in fig. 5.10) to indicate the error function is invoked after the search book. But, this is a control information and should not be shown on the DFD.
· Consider the following example. A book can be searched in the library catalog by inputting its name. If the book is available in the library, then the details of the book are displayed. If the book is not listed in the catalog, then an error message is generated. While generating the DFD model for this simple problem, many beginners commit the mistake of drawing an arrow to indicate the error function is invoked after the search book. But, this is a control information and should not be shown on the DFD.
Showing control information on a DFD – incorrect
· Another error is trying to represent when or in what order different functions (processes) are invoked and not representing the conditions under which different functions are invoked.
· If a bubble A invokes either the bubble B or the bubble C depending upon some conditions, we need only to represent the data that flows between bubbles A and B or bubbles A and C and not the conditions depending on which the two modules are invoked.
• A data store should be connected only to bubbles through data arrows. A data store cannot be connected to another data store or to an external entity.
• All the functionalities of the system must be captured by the DFD model. No function of the system specified in its SRS document should be overlooked.
• Only those functions of the system specified in the SRS document should be represented, i.e. the designer should not assume functionality of the system not specified by the SRS document and then try to represent them in the DFD.
• Improper or unsatisfactory data dictionary.
• The data and function names must be intuitive. Some students and even practicing engineers use symbolic data names such a, b, c, etc. Such names hinder understanding the DFD model.
Shortcomings of a DFD model
DFD models suffer from several shortcomings. The important shortcomings of the DFD models are the following:
• DFDs leave ample scope to be imprecise. In the DFD model, the function performed by a bubble is judged from its label. However, a short label may not capture the entire functionality of a bubble. For example, a bubble named find-book-position has only intuitive meaning and does not specify several things, e.g. what happens when some input information are missing or are incorrect. Further, the find-book position bubble may not convey anything regarding what happens when the required book is missing.
• Control aspects are not defined by a DFD. For instance, the order in which inputs are consumed and outputs are produced by a bubble is not specified. A DFD model does not specify the order in which the different bubbles are executed. Representation of such aspects is very important for modeling real-time systems.
• The method of carrying out decomposition to arrive at the successive levels and the ultimate level to which decomposition is carried out are highly subjective and depend on the choice and judgment of the analyst. Due to this reason, even for the same problem, several alternative DFD representations are possible. Further, many times it is not possible to say which DFD representation is superior or preferable to another one.
• The data flow diagramming technique does not provide any specific guidance as to how exactly to decompose a given function into its subfunctions and we have to use subjective judgment to carry out decomposition.

Comments are closed