
The aim of structured design is to transform the results of the structured analysis (i.e. a DFD representation) into a structure chart. Structured design provides two strategies to guide transformation of a DFD into a structure chart.
• Transform analysis
• Transaction analysis
Normally, one starts with the level 1 DFD, transforms it into module representation using either the transform or the transaction analysis and then proceeds towards the lower-level DFDs. At each level of transformation, it is important to first determine whether the transform or the transaction analysis is applicable to a particular DFD. These are discussed in the subsequent subsections.
Structure Chart
A structure chart represents the software architecture, i.e. the various modules making up the system, the dependency (which module calls which other modules), and the parameters that are passed among the different modules. Hence, the structure chart representation can be easily implemented using some programming language. Since the main focus in a structure chart representation is on the module structure of the software and the interactions among different modules, the procedural aspects (e.g. how a particular functionality is achieved) are not represented.
The basic building blocks which are used to design structure charts are the following:
• Rectangular boxes: Represents a module.
• Module invocation arrows: Control is passed from one module to another module in the direction of the connecting arrow.
• Data flow arrows: Arrows are annotated with data name; named data passes from one module to another module in the direction of the arrow.
• Library modules: Represented by a rectangle with double edges.
• Selection: Represented by a diamond symbol.
• Repetition: Represented by a loop around the control flow arrow.
Structure Chart vs. Flow Chart
We are all familiar with the flow chart representation of a program. Flow chart is a convenient technique to represent the flow of control in a program. A structure chart differs from a flow chart in three principal ways:
• It is usually difficult to identify the different modules of the software from its flow chart representation.
• Data interchange among different modules is not represented in a flow chart.
• Sequential ordering of tasks inherent in a flow chart is suppressed in a structure chart.
Transform Analysis
Transform analysis identifies the primary functional components (modules) and the high-level inputs and outputs for these components. The first step in transform analysis is to divide the DFD into 3 types of parts:
• Input
• Logical processing
• Output
The input portion of the DFD includes processes that transform input data from physical (e.g. character from terminal) to logical forms (e.g. internal tables, lists, etc.). Each input portion is called an afferent branch.
The output portion of a DFD transforms output data from logical to physical form. Each output portion is called an efferent branch. The remaining portion of a DFD is called the central transform.
In the next step of transform analysis, the structure chart is derived by drawing one functional component for the central transform, and the afferent and efferent branches. These are drawn below a root module, which would invoke these modules.
Identifying the highest-level input and output transforms requires experience and skill. One possible approach is to trace the inputs until a bubble is found whose output cannot be deduced from its inputs alone. Processes which validate input or add information to them are not central transforms. Processes which sort input or filter data from it are. The first level structure chart is produced by representing each input and output unit as boxes and each central transform as a single box.
In the third step of transform analysis, the structure chart is refined by adding sub-functions required by each of the high-level functional components. Many levels of functional components may be added. This process of breaking functional components into subcomponents is called factoring. Factoring includes adding read and write modules, error-handling modules, initialization and termination process, identifying customer modules, etc. The factoring process is continued until all bubbles in the DFD are represented in the structure chart.
Example: Structure chart for the RMS software
For this example, the context diagram was drawn earlier. To draw the level 1 DFD, from a cursory analysis of the problem description, we can see that there are four basic functions that the system needs to perform – accept the input numbers from the user, validate the numbers, calculate the root mean square of the input numbers and, then display the result.
Level 1 DFD
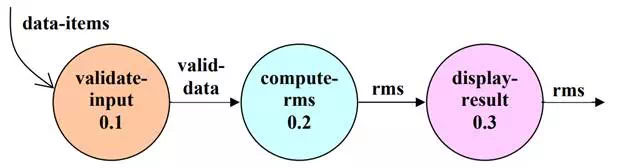
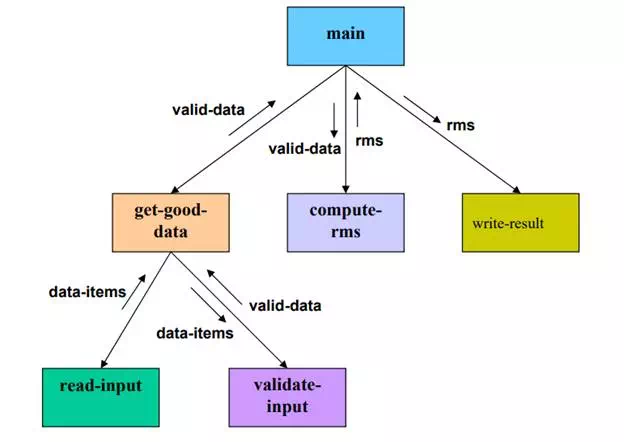
By observing the level 1 DFD, we identify the validate-input as the afferent branch and write-output as the efferent branch. The remaining portion (i.e. compute-rms) forms the central transform. By applying the step 2 and step 3 of transform analysis, we get the structure chart.
Structure chart
Transaction Analysis
A transaction allows the user to perform some meaningful piece of work. Transaction analysis is useful while designing transaction processing programs. In a transaction-driven system, one of several possible paths through the DFD is traversed depending upon the input data item. This is in contrast to a transform centered system which is characterized by similar processing steps for each data item. Each different way in which input data is handled is a transaction. A simple way to identify a transaction is to check the input data. The number of bubbles on which the input data to the DFD are incident defines the number of transactions. However, some transaction may not require any input data. These transactions can be identified from the experience of solving a large number of examples.
For each identified transaction, trace the input data to the output. All the traversed bubbles belong to the transaction. These bubbles should be mapped to the same module on the structure chart. In the structure chart, draw a root module and below this module draw each identified transaction a module. Every transaction carries a tag, which identifies its type. Transaction analysis uses this tag to divide the system into transaction modules and a transaction-center module.
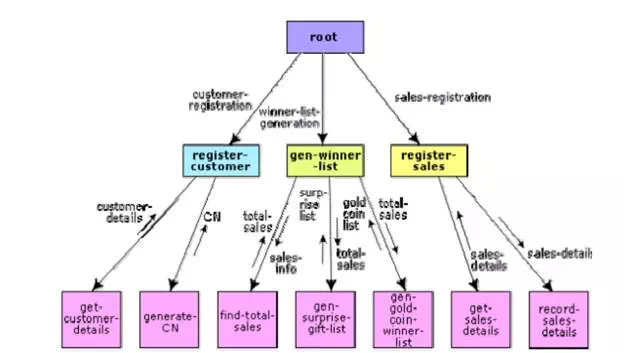
Structure chart for the supermarket prize scheme

Comments are closed