
A user opens a page, taps a button, and waits. Nothing has crashed. The interface eventually responds. Yet the pause is long enough to make the application feel unreliable.
Teams often react by guessing: add a cache, upgrade a database, rewrite a loop, or provision a larger server. Sometimes those changes help. Just as often, they consume time while the actual bottleneck remains untouched.
Slow applications are rarely slow for one obvious reason. A request may cross several services, wait on a connection pool, allocate excessive memory, trigger a costly query, or block the main user-interface thread.
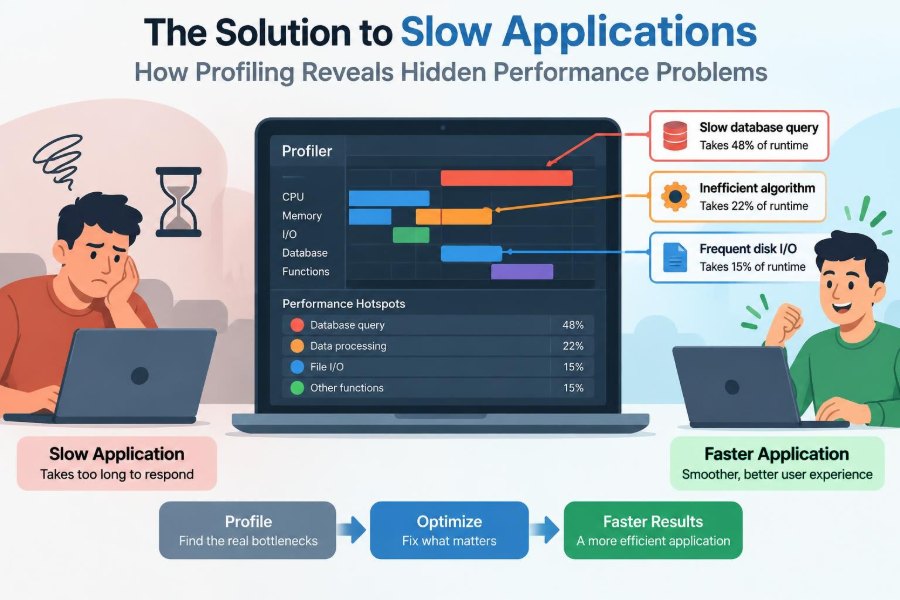
Profiling replaces intuition with evidence. It shows where an application spends time, CPU, memory, and waiting time, so engineers can improve the part that actually limits performance.
🧭 Performance Starts With a Useful Question
“Why is the app slow?” is too broad to investigate efficiently. A better question is: “Which user action is slow, for whom, under what conditions, and where does its time go?”
For example, a product search may be slow only for users with large accounts, only after a cache expires, or only on mobile devices. Those are different problems with different fixes.
Define the affected path before opening a profiler. Name the action, expected behavior, observed delay, environment, and frequency. This prevents a common failure mode: optimizing code that is unrelated to the user-visible issue.
⏱️ What “Slow” Actually Means
Performance is not a single metric. A web page can render its first screen quickly but remain unresponsive. An API can have a fast average response while occasionally taking long enough to cause a timeout.
Useful measurements include:
- Latency: elapsed time for one operation, such as an API request.
- Throughput: work completed over time, such as requests per second.
- Responsiveness: how quickly an interface reacts to input.
- Resource use: CPU, memory, disk, network, threads, and connections.
Improving one dimension can harm another. Batching work may improve throughput but make an individual request wait longer. Good optimization starts by choosing the outcome that matters.
🔎 Profiling Is Measurement, Not Guesswork
A profiler records or samples what a program does while it runs. Depending on the tool, it can show function calls, execution time, allocation activity, thread states, database calls, and system events.
Think of it as a time-lapse map of a program’s work. Rather than reading every line and predicting cost, you observe the behavior of the running system under a meaningful workload.
Profiling does not automatically supply the correct fix. It supplies evidence: a slow function, a blocked thread, a growing heap, or a repeated expensive call. Engineers still need to explain why that evidence appears.
🧱 The Bottleneck Is the Constraint
A bottleneck is the resource or step that limits the system’s useful speed. Making other parts faster may produce no visible improvement if the bottleneck remains unchanged.
Imagine a checkout request that spends 20 milliseconds in application code and 900 milliseconds waiting for a database query. Rewriting the application code to take 10 milliseconds is technically an improvement, but users will barely notice.
The constraint can also move. After optimizing the query, connection-pool contention or an external payment call may become the next limiting factor. Performance work is therefore iterative rather than a one-time cleanup.
📊 Start With a Baseline
Before changing code, capture a baseline: the current behavior under a known scenario. Without one, a change that “feels faster” can hide regressions, shift load elsewhere, or simply reflect a quieter test environment.
A useful baseline records the operation, input size, concurrency level, elapsed time, error rate, and relevant resource usage. For user-facing work, record both a typical case and a realistic difficult case.
Repeat measurements. Individual runs vary because of scheduling, cache state, network conditions, background activity, and just-in-time compilation. Look for stable patterns rather than treating one number as a verdict.
🎯 Measure the Right User Journey
Synthetic benchmarks are valuable, but they can accidentally measure a path no real user takes. Profiling a tiny sample payload may miss the cost of pagination, authorization checks, image processing, or account-specific data.
Build a representative scenario. If a reporting screen is slow for customers with many records, use safely anonymized or generated data with similar shape and volume.
Also separate cold and warm behavior. The first request after deployment may load code, establish connections, or populate caches. That cost matters if users encounter it, but it should not be confused with steady-state performance.
🧪 Reproduce Before You Optimize
A reproducible slow case turns a vague complaint into an engineering experiment. It lets the team profile repeatedly, compare alternatives, and verify that a fix holds.
Record the request parameters, application version, feature flags, dataset characteristics, and sequence of actions. A slowdown triggered only after editing a form three times may point to retained state rather than a slow initial render.
Production issues are not always safe or practical to reproduce exactly. When that is true, collect carefully scoped observability data in production and recreate the closest safe version in a controlled environment.
🧰 Choose a Profiler for the Question
Different tools expose different evidence. A CPU profiler cannot by itself explain a request that is mostly waiting for a remote service, while a database query plan cannot explain a browser rendering stall.
| Tool or signal | Best question answered | Typical clue |
|---|---|---|
| CPU profiler | Which code consumes processor time? | Hot functions and call stacks |
| Wall-clock profiler | Where does elapsed request time go? | Waiting, blocking, and slow calls |
| Memory profiler | What allocates or retains memory? | Growing heaps and allocation sites |
| Tracer | Which service or dependency delayed a request? | Slow spans across boundaries |
| Database analysis | Why is a query expensive? | Scans, joins, locks, and plans |
Use the least intrusive tool that can answer the current question. Deep instrumentation is powerful, but it can alter timing and generate more data than the investigation needs.
🧠 Sampling and Instrumentation Tell Different Stories
Sampling profilers periodically inspect the running program and record what each thread is doing. Over many samples, frequently observed functions emerge as likely hot spots. Sampling usually has relatively low overhead.
Instrumentation records selected function entries, exits, or events. It can provide precise call counts and timings, but wrapping every method may add significant overhead and distort a very fast workload.
Sampling is often a strong first choice for a live-like system. Instrumentation is particularly useful when investigating a narrower path, counting repeated calls, or examining a controlled test run.
🔥 Read Flame Graphs as Aggregated Evidence
A flame graph summarizes many recorded call stacks. Each rectangle is a function; its width represents how much sampled time appeared in that function or beneath it. Vertical position represents the calling relationship, not chronological order.
A wide section deserves attention, but it is not automatically bad. A function may be wide because it coordinates work below it. Follow the stack downward until you find the costly operation, such as serialization, parsing, compression, or a repeated lookup.
Do not interpret the colors as severity unless the specific tool documents that meaning. In many flame graphs, colors are simply visual variation.
🧵 Thread States Reveal Waiting Work
High latency with low CPU use is a valuable clue. It often means work is waiting: on a lock, database connection, file operation, network response, queue, or another thread.
Thread timelines and dumps can show whether threads are runnable, blocked, sleeping, or waiting. If many request threads are waiting for the same resource, adding CPU cores will not solve the underlying contention.
Look for patterns rather than one blocked thread. A single brief wait can be normal; a pool of workers repeatedly stalled behind the same lock is a capacity and design signal.
⚙️ CPU Hot Spots Need Context
CPU profiles identify code actively using processor time. Common hot spots include inefficient algorithms, repeated conversions, expensive regular expressions, compression, encryption, JSON processing, and rendering calculations.
Suppose a hypothetical endpoint sorts a large list several times because separate helper methods each create their own ordered copy. The profiler may reveal sorting as the dominant work. Reusing one sorted representation may be more effective than micro-optimizing comparisons.
First confirm that the CPU work is necessary. Then consider algorithmic complexity, input size limits, caching, batching, and avoiding duplicated computation.
🗃️ Database Time Is Often Hidden Behind Application Code
An application method can look slow because it waits for a query. If database calls are not separately visible, engineers may blame the method’s surrounding code and optimize the wrong layer.
Capture query duration, query count, rows examined or returned where available, and execution plans for troublesome queries. A plan explains how the database intends to retrieve data; it can reveal broad scans, costly joins, poor estimates, or sorting work.
Indexes can help, but they are not universal medicine. They consume storage and impose write-maintenance cost. An index should support a demonstrated query pattern, not merely appear because a table is large.
🔁 Find the N+1 Query Pattern
An N+1 query problem occurs when code loads one collection, then issues another query for each item. A page showing 100 orders may quietly produce 101 database calls.
This pattern commonly appears in object-relational mapping code when related data is loaded lazily inside a loop. Each query can be fast in isolation, while the combined network and database overhead makes the page slow.
Profile both elapsed time and query count. Solutions may include fetching required relationships together, batching keys into a single query, or redesigning the read model for the screen. Fetching everything indiscriminately can create a different memory problem.
🌐 Network Delays Are Part of the Request
A service can be internally efficient and still feel slow because it calls other services. Name resolution, connection setup, TLS negotiation, limited connection pools, payload size, retries, and remote processing all contribute to elapsed time.
Distributed tracing divides a request into spans across service boundaries. It helps distinguish a slow recommendation service from time spent merely waiting to obtain a connection to it.
Retries deserve special care. They improve resilience in some transient failures, but synchronized retries can multiply load during an outage. Use timeouts, bounded retries, and backoff policies that fit the dependency and the user experience.
🧮 Serialization Can Become a Quiet Hot Spot
Turning objects into JSON, decoding messages, formatting dates, and copying large structures can consume surprising CPU and memory. These costs increase with payload size and with the number of times data is transformed between layers.
Profile representative payloads rather than small test objects. A response containing deeply nested records may require expensive reflection or allocate many short-lived objects before a byte reaches the network.
Useful remedies include returning only fields the client needs, avoiding duplicate transformations, streaming large results where appropriate, and choosing formats deliberately. Smaller payloads can reduce both server work and network time.
🧹 Memory Allocation Creates Work Later
Allocation itself is often fast, but frequent allocation creates pressure for garbage collection or memory management. When memory is reclaimed, application threads may be interrupted or compete for CPU, increasing latency.
Allocation profiles identify where objects are created. A common pattern is repeated construction of temporary strings, collections, or buffers inside a high-frequency loop.
Do not treat every allocation as a bug. Clear, short-lived objects are often preferable to complicated object reuse. Investigate allocation when it is high-volume, drives collection pauses, or causes memory growth that threatens capacity.
🧠 Retained Memory Is Different From Allocation
A memory leak is memory that remains reachable when the application no longer needs it. The process may work normally at first, then slow down as memory use grows, collection becomes more frequent, or the runtime reaches its limit.
Heap snapshots show retained objects and the reference paths keeping them alive. Common causes include unbounded caches, event listeners that are never removed, global collections, queued tasks, and sessions held longer than intended.
A growing heap is not proof of a leak. Some applications deliberately cache data or expand under load. The key question is whether retained memory stabilizes after demand falls and whether its growth has a valid bound.
🔒 Lock Contention Turns Parallel Work Into a Queue
Locks protect shared state, but a broad or frequently held lock can serialize work that should run concurrently. As request volume rises, waiting threads accumulate behind the owner of the lock.
Profiles may show time in synchronization primitives rather than business logic. Examine what happens while the lock is held: database calls, file access, logging, or expensive computation inside a critical section are especially damaging.
Possible fixes include reducing shared mutable state, narrowing the protected region, using partitioned data structures, or changing the workflow. Correctness comes first; removing synchronization without a safe design can introduce subtle data corruption.
📥 Queues and Pools Can Hide Saturation
Thread pools, database pools, worker queues, and connection pools protect systems from unbounded concurrency. But when a pool is exhausted, new work waits, and that waiting can appear as a mysterious slowdown.
Monitor pool size, active usage, wait duration, queue depth, and task duration together. Raising a pool limit may help if capacity was unnecessarily constrained, but it can also overload a database or downstream service.
The more durable fix is often to reduce slow work, set sensible concurrency limits, or add backpressure: a controlled way to slow incoming work before the system fails unpredictably.
🖥️ Front-End Profiling Follows the Main Thread
In a browser or desktop interface, the main thread often handles input, scripting, layout, and painting. Long tasks prevent clicks, typing, and animations from being handled promptly.
Performance timelines can show whether a slow interaction is caused by JavaScript execution, forced layout recalculation, large rendering updates, image decoding, or a network request. A server-side trace alone cannot reveal these client-side stalls.
For example, filtering a large table on every keystroke may repeatedly rebuild the entire interface. Debouncing input, virtualizing off-screen rows, or moving heavy calculations off the main thread can improve responsiveness without changing the server.
📈 Tail Latency Matters More Than a Comfortable Average
An average can conceal frustrating outliers. If most requests finish quickly while a smaller group waits much longer, the average may look acceptable even though real users regularly experience delays.
Inspect percentiles and distributions when your monitoring system provides them. The goal is not to worship a particular percentile number, but to understand whether the slow tail comes from a recurring dependency delay, lock contention, cache miss, or input-specific path.
Profile slow examples separately. A profile of a typical request may never capture the condition responsible for the worst user experiences.
🧩 Production Needs Observability, Not Constant Deep Profiling
Development profiling is detailed and interactive. Production systems require continuous, low-risk signals: request metrics, logs with useful context, traces, resource data, and alerts aligned with user impact.
Some environments support low-overhead continuous profiling, which can help connect a production slowdown to code paths over time. Whether it is appropriate depends on runtime overhead, privacy rules, data sensitivity, and operational controls.
Never assume profiling data is harmless. Stack traces, request attributes, and captured parameters can expose sensitive information. Minimize collection, restrict access, and follow the organization’s security and retention practices.
🧯 Benchmark Changes, Not Just Whole Systems
After identifying a likely fix, create a focused benchmark or repeatable scenario that tests it. This makes it easier to compare implementations and detect a regression during review or later maintenance.
Benchmark realistic inputs and warm-up behavior where relevant. Avoid measuring debug logging, setup work, or random network calls unless those are part of the behavior being evaluated.
Microbenchmarks have limits. A faster isolated function can make no difference to a full request, and compiler or runtime optimizations may make artificial loops misleading. Pair narrow benchmarks with end-to-end measurements.
✅ Validate the Fix Under Realistic Load
A change is not complete when one local profile looks better. Re-run the original scenario, compare it with the baseline, and observe resource usage and error behavior under representative concurrency.
Check for trade-offs. Caching may lower latency but increase memory. Parallel requests may shorten one operation but saturate a shared dependency. A smaller response may require a client change that affects compatibility.
Use gradual rollout and monitoring when possible. Production traffic has data shapes, network conditions, and usage patterns that test environments may not reproduce.
🚫 Common Profiling Mistakes
The biggest mistake is optimizing before measuring. It encourages elegant changes that solve a theoretical problem rather than the current one.
- Profiling an unrepresentative test case and generalizing the result.
- Confusing CPU time with elapsed time when most work is waiting.
- Fixing a visible function instead of the expensive work it invokes.
- Comparing one noisy run with another and claiming a win.
- Adding caches before understanding invalidation, memory bounds, and hit rates.
- Ignoring query counts, dependency calls, queue waits, and pool saturation.
A disciplined investigation narrows uncertainty one measurement at a time.
🛠️ A Repeatable Investigation Workflow
- Define the user-visible slow operation and the performance goal.
- Reproduce it with representative inputs and record a baseline.
- Determine whether time is spent on CPU, waiting, memory management, I/O, or the user interface.
- Capture a focused profile, trace, query analysis, or heap snapshot.
- Form a specific hypothesis from the evidence.
- Make the smallest safe change that tests that hypothesis.
- Measure again, including relevant trade-offs and tail behavior.
- Document the cause, fix, and guardrail so the problem is less likely to return.
This workflow is deliberately unglamorous. Its strength is that each step produces information that makes the next decision more reliable.
📚 Build Performance Knowledge Into the Codebase
Performance fixes fade when their reasoning lives only in one engineer’s memory. Document important constraints: why a query uses a particular index, why a cache has a bounded size, or why a loop processes data in batches.
Automated performance checks can protect especially sensitive paths, but thresholds need maintenance and tolerance for normal variation. A brittle test that fails frequently without user impact will soon be ignored.
Code review should ask practical questions: What is the input size? How many remote calls occur? Does this allocate in a hot loop? What happens under concurrency? These questions catch many issues before profiling is needed.
🌱 Optimize for the System You Actually Have
Not every slow-looking operation deserves immediate optimization. A nightly task that uses extra CPU for a few seconds may be acceptable, while a small delay in an interactive payment flow may have a much higher cost.
Prioritize by user impact, frequency, operational risk, and engineering effort. Keep the code understandable unless measurement demonstrates that added complexity pays for itself.
Performance engineering is not a contest to produce the lowest possible number. It is the practice of delivering predictable, appropriate behavior with finite resources.
🏁 The Core Principle: Follow the Evidence
Slow applications invite confident guesses because many causes sound plausible. The database may be slow. The framework may be heavy. The server may need more memory. Any of those can be true, but none is a diagnosis.
Profiling reveals the path from symptom to cause: where time is consumed, what resources are constrained, which work repeats, and where requests wait. That evidence lets teams target changes, verify results, and avoid performance folklore.
The practical habit is simple: measure a real problem, identify the limiting work, change one meaningful thing, and measure again.
The fastest route to a faster application is not clever guessing; it is disciplined measurement followed by focused improvement. ⚙️📊🔍