
A customer opens your app to pay a bill, submit coursework, or check an order. Instead of the expected screen, they see a timeout. The incident may last only a few minutes, but for that customer, the service was simply unavailable at the moment it mattered.
Teams often describe reliability with phrases such as “five nines,” “high uptime,” or “our availability target.” Those phrases are useful only when everyone means the same thing and measures it consistently.
Availability calculations look simple: divide working time by total time. The difficult part is deciding what counts as working, whose experience is being measured, which outages belong in the calculation, and what a percentage means in minutes of allowed failure.
Understanding those choices helps engineers set realistic service objectives, explain trade-offs, and focus reliability work where users will actually notice it.
🧭 Availability is a user-facing reliability measure
Software availability is the proportion of time a service performs its intended function during a defined period. In its simplest form, it answers: “Could a user successfully use the service when they tried?”
Availability is related to reliability, but they are not identical. Reliability concerns consistent operation over time; availability includes both how often failures occur and how quickly the system recovers from them.
⏱️ Uptime and downtime are the raw ingredients
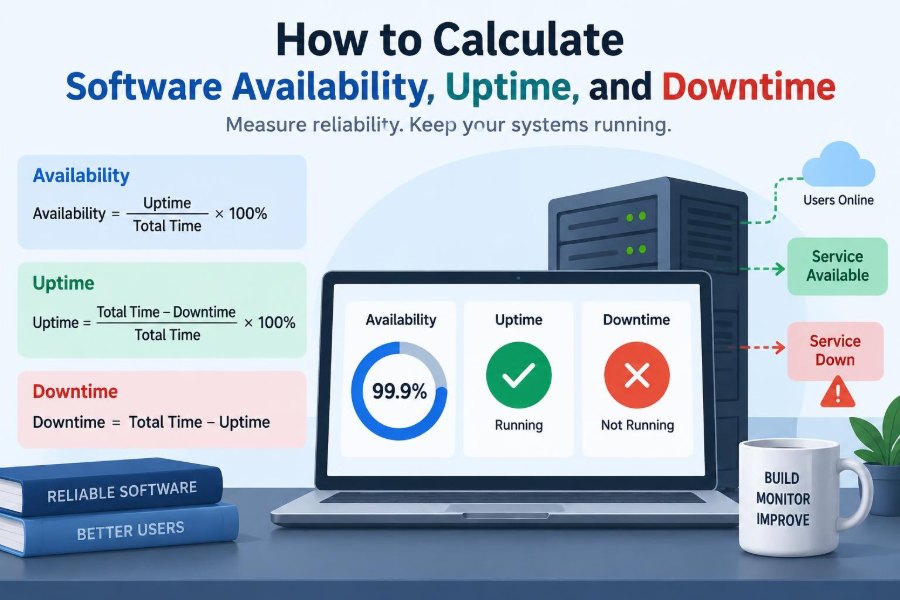
Uptime is time during which the service meets its agreed operational definition. Downtime is time during which it does not. Together, they make the measurement window.
For a basic calculation, the relationship is:
Total time = Uptime + DowntimeThis is easy to state, but a useful measurement needs a precise definition of “the service.” A healthy server process is not enough if requests fail, authentication is broken, or the database is unreachable.
🧮 The basic availability formula
The standard formula is:
Availability (%) = (Uptime / Total time) × 100Because uptime equals total time minus downtime, teams often use the equivalent form:
Availability (%) = ((Total time − Downtime) / Total time) × 100If a service is measured over 30 days and has 43.2 minutes of qualifying downtime, its availability is 99.9%. The arithmetic is straightforward; the policy behind “qualifying downtime” deserves much more care.
📅 Always state the measurement window
A percentage without a period can mislead. A service might be fully available over one day and still have poor availability over a month because of a long outage earlier in the period.
Common windows include rolling 7, 28, or 30 days; calendar months; quarters; and a year. A rolling window responds continuously to recent incidents, while a calendar window can align neatly with business reporting. Pick one deliberately and document it.
🔢 Convert a percentage into allowed downtime
Availability targets become more tangible when converted into a downtime budget. Multiply total time by one minus the target availability.
Allowed downtime = Total time × (1 − Target availability)For example, a 99.9% target allows 0.1% downtime. In a 30-day period, that is about 43 minutes. A 99.99% target allows about 4.3 minutes in the same period, which is a dramatically tighter operational constraint.
📊 A practical availability reference table
The following values are approximate because months have different lengths. They are useful for planning, not a substitute for calculating against the actual measurement window.
| Target availability | Maximum downtime in 30 days | Interpretation |
|---|---|---|
| 99% | About 7 hours 12 minutes | Noticeable outages can fit within the target. |
| 99.9% | About 43 minutes | Recovery and incident response must be efficient. |
| 99.95% | About 22 minutes | Brief incidents consume a meaningful budget. |
| 99.99% | About 4 minutes 19 seconds | Architecture and operations need strong resilience. |
🎯 Define what “available” means before measuring
A service is not automatically available because a health endpoint returns HTTP 200. The definition should reflect a meaningful user action or system contract.
For an online store, availability may mean that customers can browse, add items to a cart, and complete checkout. For an internal data API, it may mean authenticated clients receive correct responses within an agreed latency limit.
- Which user journeys or API operations are covered?
- Which regions, tenants, and client types count?
- What error rate or latency threshold makes the service unavailable?
- Are partial failures measured separately or as full outages?
👥 Measure from the perspective that matters
Infrastructure metrics and user experience can disagree. A load balancer may be reachable while a mobile app cannot log in due to an identity-provider failure. Conversely, one unhealthy instance may not affect users if traffic is safely routed elsewhere.
Use multiple perspectives: internal component health for diagnosis, synthetic checks for independent end-to-end testing, and real-user or request data for observed impact. The availability objective should usually be closest to the consumer’s experience.
🔍 Synthetic monitoring tests known journeys
Synthetic monitoring runs scripted checks from selected locations at regular intervals. A check might load a page, authenticate using a test account, call an API, or create and then remove a test record.
Its strength is consistency: it can detect failure when real traffic is low. Its limitation is scope. A script only proves that its particular route, credentials, data, and location worked. It does not represent every user condition.
📈 Request-based measurement captures real traffic
Request-based availability derives status from production requests, often using successful versus unsuccessful requests over time. It can reveal problems limited to a region, endpoint, browser, or customer segment.
However, raw request success is not always a service-level answer. Retries can inflate request volume, bots can distort results, and a low-traffic service may have no requests during an outage. Define eligible requests and combine this view with active checks where appropriate.
🚦 Errors and slow responses both affect availability
A request that returns an error is clearly unsuccessful. But a request that takes 90 seconds when users expect a response in two seconds may be operationally unavailable too, even if it eventually returns success.
This is why many teams define availability with an SLI, or service level indicator, such as the fraction of valid requests that complete successfully within a latency threshold. The threshold should reflect user needs rather than an arbitrary technical convenience.
🧩 Partial outages need a proportional view
Not every incident makes every feature unavailable. Search may fail while account management works; one cloud region may be impaired while another remains healthy; only a subset of tenants may be affected.
Do not hide a serious partial failure merely because one server stayed up. At the same time, treating a tiny optional feature as a full-site outage can overstate impact. Use separate indicators for important journeys, and report the scope alongside the percentage.
🌍 Regional availability can differ sharply
A globally deployed service may have excellent aggregate availability while users in one region repeatedly experience failures. Aggregation can conceal unequal outcomes.
Measure by region when routing, dependencies, compliance boundaries, or network paths differ. You may publish a global objective while operating regional objectives internally. The right aggregation depends on the promise made to users and customers.
🧱 Dependencies are part of the user experience
Modern services depend on DNS, identity systems, payment providers, databases, queues, cloud platforms, and third-party APIs. A dependency outage can make your feature unusable even when your own code and servers are healthy.
For a user-facing availability metric, the cause usually matters less than the outcome. For operational analysis and contracts, track dependency-caused incidents separately so ownership and mitigation remain clear.
🛠️ Planned maintenance is a policy decision
Some organizations exclude approved maintenance from availability calculations. Others include it because users cannot use the service regardless of why it is unavailable. Neither rule is universally correct.
The risk is changing the rule after an incident. State in advance whether maintenance is excluded, how much notice is required, whether emergency work qualifies, and whether a maintenance window itself has a limit.
📝 Service level indicators make measurement concrete
An SLI is the measured quantity. It turns a broad idea such as “the API is available” into an observable definition.
A common request-based SLI is:
Availability SLI = Good events / Eligible events“Good” might mean an authenticated read request returns a valid response in under 500 milliseconds. “Eligible” might exclude malformed client requests but include timeouts, server errors, and dependency failures that affect normal callers.
🤝 SLOs, SLAs, and targets are not interchangeable
An SLO, or service level objective, is the desired level for an SLI, such as 99.9% successful requests in a rolling 30 days. It guides engineering decisions.
An SLA, or service level agreement, is an external commitment that may define remedies if a provider misses its terms. A dashboard target may simply be an internal aspiration. Keep these concepts distinct so an internal alert threshold is not mistaken for a contractual promise.
💳 Error budgets connect reliability to delivery speed
An error budget is the amount of failure permitted by an SLO. With a 99.9% availability objective, the budget is 0.1% of eligible time or events, depending on the SLI design.
If the budget is mostly consumed, teams may slow risky deployments, prioritize remediation, or add safeguards. If it remains healthy, they can accept more delivery risk. This is not punishment; it is a shared mechanism for balancing feature work and reliability.
🧑💻 A worked time-based example
Consider a hypothetical internal reporting portal measured over a 28-day period. The total period contains 40,320 minutes. The team records a 25-minute authentication outage and a 15-minute database incident that prevented reports from loading.
Assuming both incidents qualify as downtime and no maintenance is excluded, downtime is 40 minutes:
Availability = (40,320 − 40) / 40,320 × 100
Availability ≈ 99.9008%
The portal met a 99.9% objective by a very small margin. That result should prompt learning, not celebration: one similarly sized incident would put the target at risk.
📨 A worked request-based example
Imagine a hypothetical API with 2,000,000 eligible requests in a month. Of those, 1,998,600 meet both the success and latency criteria. The remaining 1,400 requests time out or return qualifying server-side failures.
Availability = 1,998,600 / 2,000,000 × 100
Availability = 99.93%
This calculation measures user-visible request outcomes, not elapsed outage minutes. It can be more representative for high-traffic APIs, but it requires careful rules for retries, client errors, and sampling.
🔄 Mean time to recovery influences availability
MTTR commonly means mean time to recovery or repair: the average time needed to restore service after an incident. Lower MTTR usually improves availability because each failure consumes less downtime.
It does not tell the whole story. A service can have a low MTTR but fail frequently, frustrating users with repeated interruptions. Track failure frequency and impact alongside recovery time.
🧠 Mean time between failures has limits
MTBF, mean time between failures, estimates the average operational time between failures in some contexts. It is often useful for discussing components or repeated failure patterns.
Do not assume it predicts a complex distributed system perfectly. Software failures can arise from deployments, traffic shifts, data conditions, expired credentials, and shared dependencies rather than random independent events. Real incident data and scenario testing matter.
🧮 Availability is not the same as reliability multiplication
For independent components arranged in series, a simplified model multiplies their availabilities: if every component must work, the overall probability of operation is lower than each component alone. Redundant parallel paths can improve the modelled result.
These models are useful for architecture reasoning, but their assumptions are strong. Components may fail together because they share a region, credential, deployment pipeline, or network dependency. Model common-mode failures instead of assuming independence.
🏗️ Redundancy improves resilience only when it is real
Multiple instances, replicas, and failover paths can reduce downtime, but redundancy is not automatic availability. A standby database is ineffective if failover is untested; two services in one availability zone still share important risks.
Useful resilience work includes removing single points of failure, testing failover, limiting blast radius, and ensuring capacity remains after one component is lost. Every added component also creates operational complexity, so prioritize failures that meaningfully affect users.
🚨 Incident timestamps must follow consistent rules
For time-based reporting, record when impact began, when it was detected, when mitigation started, and when users recovered. The availability clock should normally follow user impact, not the time an engineer first saw an alert.
Document whether recovery requires all users to succeed, a stable monitoring period, or merely a temporary workaround. Inconsistent timestamps can make a polished-looking report less trustworthy than a plainly conservative one.
🧹 Avoid common calculation mistakes
Several mistakes appear repeatedly in availability reporting:
- Using server process uptime as proof of application availability.
- Reporting a percentage without its measurement period or scope.
- Excluding inconvenient incidents as “third-party” failures without an agreed policy.
- Counting every HTTP 4xx response as a service outage, including invalid client requests.
- Ignoring latency, partial impact, or regional disparities.
- Rounding early enough to conceal a missed objective.
- Combining services with different user importance into one opaque number.
Clear definitions and preserved raw data are more valuable than an impressive but ambiguous percentage.
📋 Build a measurement specification
A short measurement specification prevents arguments during incidents and audits. It should be understandable by engineering, support, product, and any customer-facing teams.
- Name the service, users, regions, and critical journeys covered.
- Define the SLI, data source, success criteria, and latency boundary.
- Set the reporting window, SLO, rounding method, and exclusion rules.
- Explain treatment of maintenance, dependencies, partial failures, and missing telemetry.
- Assign an owner for dashboard quality and periodic review.
📡 Instrument the system before trusting the dashboard
Availability measurement depends on telemetry: logs, metrics, traces, probes, and incident records. Instrument key outcomes rather than only internal activity. For example, record whether a checkout completed, not merely whether a checkout worker started.
Protect the measurement pipeline as well. Missing data should not silently become success. Establish a visible policy for telemetry gaps, such as marking the period unknown, using an independent monitor, or treating the gap conservatively.
🔔 Alert on user impact, not every anomaly
An alert should prompt a useful response. Alerting on every single failed request creates noise; alerting only when every server is down can miss severe degradation.
Use thresholds that reflect sustained error rate, latency, affected traffic, or failed synthetic journeys. Pair urgent paging alerts with lower-priority signals for investigation. The best alerting design supports fast recovery without exhausting the people on call.
🧪 Test failure paths deliberately
Availability improves when teams learn how systems behave under stress before customers are affected. Exercises can simulate an unavailable dependency, a failed instance, a bad configuration, or exhausted capacity in a controlled environment.
These tests should have safeguards and a clear rollback plan. Their purpose is not to create disruption; it is to validate assumptions about retries, failover, observability, runbooks, and communication.
📣 Report availability with context
A useful report includes the measured value, target, period, scope, method, exclusions, and significant incidents. “99.95% available” means little without knowing whether it covers login, all regions, or only a single internal endpoint.
For leadership and customers, summarize impact plainly. For engineering teams, retain the detailed event data needed to improve. Transparency about limitations builds more trust than a single unexplained number.
⚖️ Choose targets that match consequences
Higher availability is not free. It may require redundant infrastructure, more operational coverage, safer deployment methods, stronger dependency contracts, and additional testing. Those costs are justified differently for a payroll system, a public emergency service, a hobby project, and an internal reporting tool.
Start with the harm caused by interruption: missed revenue, safety risk, contractual obligation, lost productivity, or reputational damage. Then choose objectives for the journeys where those consequences are real, rather than applying one “nines” target everywhere.
🧭 The core principle: measure the promised experience
Availability is most useful when it represents the experience a service has promised to deliver. The formula is necessary, but it is only the final step after defining users, critical functions, valid events, dependencies, and the measurement window.
Measure consistently, expose uncertainty, investigate the failures behind the percentage, and use the result to guide engineering investment. A number should lead to better decisions, not merely a better-looking status page.
Calculate availability with a clear denominator, a user-centered definition of success, and an honest record of downtime—then use the result to make the service more dependable. ⚙️📈🛠️