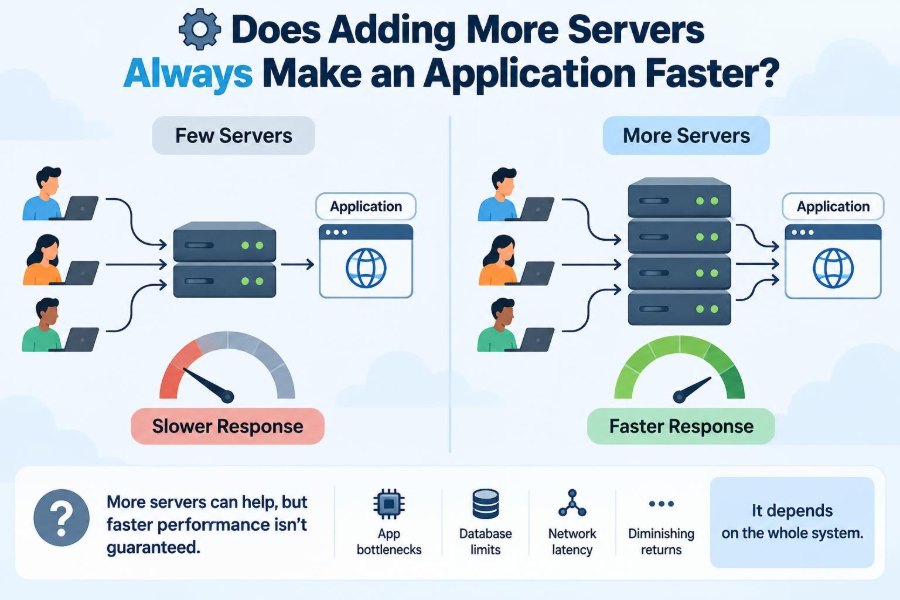

It is a familiar incident-room moment: response times are climbing, users are refreshing a slow page, and someone suggests adding more servers. The proposal feels sensible. If one checkout lane is crowded, opening several more lanes should move people through faster.
Sometimes that is exactly what happens. A stateless web application serving independent requests can often handle more traffic when additional instances share the work.
But teams also encounter the disappointing alternative: they double the server count, costs rise, and the application remains slow. Occasionally it becomes slower, because the real bottleneck was a database, a shared lock, a network dependency, or coordination introduced by the new machines.
Understanding this distinction is central to performance engineering. The useful question is not “How many servers do we need?” but “Which constrained resource is limiting this workload right now?”
🚦 Start With the Meaning of “Faster”
“Faster” can describe several different outcomes. A system may process more requests per second, complete an individual request sooner, stay responsive during a traffic spike, or recover more quickly from a failed machine. These are related, but they are not interchangeable.
Throughput is the amount of useful work completed over time, such as orders processed per minute. Latency is how long one operation takes, often measured from a user action until a response arrives. Adding servers commonly improves throughput before it improves latency.
A batch-processing service might finish a million independent jobs sooner with ten workers. Yet a single user request that must wait for a database query may see almost no improvement.
📈 Horizontal and Vertical Scaling
There are two broad ways to add computing capacity. Vertical scaling, or scaling up, gives one machine more CPU, memory, storage performance, or network capacity. Horizontal scaling, or scaling out, adds machines and distributes work among them.
More servers usually means horizontal scaling. It can provide both capacity and fault tolerance, but it requires the application to divide work safely. A larger single machine avoids some coordination overhead, though it has practical limits and can remain a single point of failure.
| Approach | Usually helps when | Typical trade-off |
|---|---|---|
| Scale up | One process needs more memory or stronger single-machine performance | Finite hardware limits and less redundancy |
| Scale out | Work can be divided across independent instances | Load balancing, coordination, and state management |
| Optimize | Work is wasteful or a specific dependency is saturated | Requires measurement and engineering time |
🧮 The Serial Work Limit
Every application has some work that cannot be divided among servers. A request may need one transaction to commit, one lock to be released, or one response to be assembled. This sequential portion limits the benefit of parallel hardware.
Amdahl’s law expresses the general idea: if part of a task is inherently serial, speeding up the parallel part eventually produces diminishing returns. The exact formula matters less in daily practice than the habit it encourages: find the work that still happens one-at-a-time.
For example, image resizing may distribute nicely across workers, while updating one shared account balance may require carefully ordered writes. More resize workers can help; more writers do not remove the need for correct serialization.
🧵 Independence Is the Key to Parallel Work
Horizontal scaling works best when requests are independent. A server receives a request, obtains the needed data, performs computation, returns a result, and does not need to coordinate heavily with its peers.
A stateless API that validates product searches is a good candidate. Many instances can answer different searches concurrently, and a load balancer can send each incoming request to any healthy instance.
Independence is not absolute. Even a seemingly stateless request may share a cache, database connection pool, rate limit, logging pipeline, or third-party API. Those shared resources determine whether added application servers create real capacity.
⚖️ Load Balancing Is Not Performance Magic
A load balancer routes traffic among servers. It can prevent one instance from being overloaded and can stop sending traffic to unhealthy instances. That is valuable, but it does not make slow code, slow storage, or a saturated database faster.
Its routing policy also matters. Round-robin distribution is simple, but requests may vary greatly in cost. Least-connections routing can help with long-lived requests, while consistent hashing may be necessary when cache locality or sharded data matters.
Health checks deserve care. A server that answers a shallow health endpoint may still be unable to reach its database. A useful design distinguishes “the process is alive” from “this instance can safely serve this class of traffic.”
🗃️ The Database Bottleneck
Many systems scale their web tier first and discover that all new instances send additional queries to the same database. The database then becomes the queue everyone shares.
Databases are capable systems, but writes often require coordination for durability and consistency. Index maintenance, locks, storage I/O, transaction conflicts, and limited connection capacity can all constrain performance. Adding API servers may increase pressure rather than relieve it.
Before adding more application instances, inspect query duration, query plans, lock waits, connection use, disk activity, and database CPU. A missing index or an unnecessarily repeated query can matter more than an entire fleet of new web servers.
🔒 Locks Turn Parallel Requests Into a Queue
A lock protects shared state from conflicting updates. For instance, two requests should not both sell the last available ticket. The correctness mechanism is necessary, but it can limit concurrency when many requests contend for the same resource.
Suppose thousands of users try to update a global counter or reserve inventory for one popular item. More servers allow more requests to arrive, but those requests may simply wait longer for the same lock.
The solution is rarely “remove all locks.” Instead, reduce the locked work, use finer-grained locking where correctness permits, partition the hot data, or redesign the workflow so not every event requires a synchronous shared update.
🌐 Network Calls Create External Waiting Time
A request often depends on services outside its own process: payment providers, identity services, search clusters, object storage, or internal APIs. When an operation spends most of its time waiting on the network, extra CPU servers cannot eliminate that waiting.
More servers may even magnify the failure. Under a slow dependency, each application instance can accumulate waiting requests, open more connections, and send retries. The downstream service receives additional load precisely when it is least able to respond.
Use explicit timeouts, bounded retries with backoff, and circuit breakers that temporarily stop calls to a failing dependency. These controls protect the application from turning a partial slowdown into a wider outage.
🧠 Memory, CPU, and I/O Behave Differently
Capacity planning starts by identifying the constrained resource. CPU-bound work includes compression, encryption, rendering, and intensive calculations. Memory-bound services may pause excessively or fail when their working set no longer fits in available memory.
I/O-bound work waits for disks, networks, or remote services. A server whose CPU is mostly idle can still be slow because threads are waiting for storage. Conversely, a fast database query will not fix an overloaded CPU performing expensive document conversion.
Measure resource saturation alongside request behavior. High latency without a saturated local resource often points downstream; high CPU on every instance points toward computation or inefficient code.
📬 Queues Smooth Bursts, Not Infinite Demand
A queue can absorb a short burst by separating request acceptance from background processing. A customer submits a video, for example, and workers transcode it later. This improves responsiveness because the user does not wait for the whole job.
Adding workers can raise the rate at which queued jobs are processed, provided workers are not blocked by the same downstream resource. But if work arrives faster than it can be completed for a sustained period, the queue grows without bound.
Monitor queue depth, age of the oldest job, processing rate, failures, and retry volume. A queue is a deliberate waiting room, not a substitute for enough capacity or a solution to an overloaded dependency.
🧊 Caching Can Remove Work Before It Starts
Scaling is most effective when the system does less unnecessary work. A cache stores a reusable result closer to where it is needed, avoiding repeated database reads or expensive computation.
A product catalog page that changes infrequently may be served from a content delivery network or application cache. In that case, one cache hit can avoid work across the web tier, network, and database.
Caches introduce their own concerns: expiration, invalidation, memory limits, cold starts, and uneven popularity. Do not cache sensitive or user-specific data carelessly. Still, for read-heavy workloads, caching often provides a larger improvement than adding identical servers.
🔥 Hot Keys and Uneven Traffic
Average load can conceal a hotspot. One celebrity post, one popular product, or one tenant with unusually large data may direct disproportionate traffic toward a single cache key, database row, shard, or partition.
Adding servers distributes general request handling, but it does not automatically distribute a hot key. In fact, many instances may simultaneously miss the same expired cache entry and all request the same data, a pattern often called a cache stampede.
Mitigations include request coalescing, staggered expiration, prewarming appropriate data, and partitioning strategies that account for uneven access. Examine percentiles and per-key behavior, not merely fleet-wide averages.
🧩 Stateful Sessions Complicate Scaling
If a user’s session lives only in one server’s memory, a later request sent to a different server may appear anonymous or lose in-progress state. Teams sometimes use sticky sessions to route a user back to the same instance.
Sticky routing can be practical temporarily, but it reduces balancing flexibility and makes failures harder to handle. A server with many active sessions may be busy while another sits idle.
Externalizing session state to a shared store, using signed tokens where suitable, or redesigning the interaction to minimize server-local state makes horizontal scaling more resilient. The right choice depends on security, revocation needs, data size, and consistency requirements.
🔁 Replication Helps Reads, With Conditions
Read replicas can distribute read traffic away from a primary database. This can help applications where reads are frequent, safely routed, and tolerant of the replica’s possible delay.
Replication is not a universal write-scaling mechanism. The primary may still coordinate writes, and replicas must eventually receive and apply them. A user who writes data and immediately reads from a lagging replica may briefly see an older view.
Design read paths deliberately. Some operations require reading from the primary or another strongly consistent source, while dashboards and noncritical browsing may safely accept a slightly delayed result.
🧱 Sharding Adds Capacity and Operational Cost
Sharding partitions data across multiple databases, often by customer, region, or key range. Each shard handles only part of the total workload, which can increase aggregate storage and write capacity.
The cost is complexity. The application must locate the correct shard, distribute data reasonably evenly, handle rebalancing, and avoid expensive cross-shard queries. A poorly chosen shard key can concentrate the busiest customers on one shard.
Sharding is a significant architectural step, not a first response to a slow endpoint. It is justified when a measured data-store limit persists after query, schema, caching, and workload improvements have been considered.
🕰️ Coordination Has a Latency Cost
Distributed systems exchange messages. Servers may need to discover membership, synchronize state, elect a leader, invalidate caches, or replicate data. Each coordination step adds failure modes and time.
This is why ten servers do not behave like one server that is ten times faster. The additional machines create useful parallelism, but they also create communication and consistency work.
Keep the critical path short. A request should synchronously contact only the services necessary to provide a correct response. Move nonessential analytics, notifications, and enrichment to asynchronous processing when product requirements allow.
📊 Latency Percentiles Tell the Real Story
An average response time can look healthy while a meaningful minority of users experiences severe delays. Percentiles describe the distribution: a high percentile shows how slow the slower requests are, not just the typical one.
Tail latency often grows under load because queues form. One slow database query or a brief network pause can hold scarce worker threads, causing later requests to wait even if their own work is simple.
Track latency by endpoint, dependency, status code, and traffic type. Pair percentiles with throughput and error rates; a system can appear faster simply because it is rejecting or timing out more work.
🧪 Load Tests Must Resemble Reality
A load test that repeatedly requests one cached endpoint from a fast internal network may prove little about production behavior. Representative tests include realistic request mixes, payload sizes, authentication, cache warmth, data distributions, and downstream dependency behavior.
Increase load gradually and observe where response time bends upward, errors increase, or queues grow. That inflection is often more informative than a single “maximum requests per second” number.
Test failure scenarios too. A dependency that becomes slow, a cache that is cold, or one instance that disappears can reveal whether autoscaling and retry behavior are safe under stress.
🔍 Observability Locates the Constraint
Adding servers without evidence is capacity guessing. Observability combines metrics, logs, traces, and profiles to show what the application is doing and where time is spent.
- Metrics reveal rates, saturation, queue lengths, errors, and latency trends.
- Traces follow a request across services and expose slow spans on its path.
- Profiles identify costly functions, allocations, lock contention, and CPU use inside a process.
- Logs provide diagnostic context, but should be structured and sampled carefully at high volume.
Instrumentation has cost, so collect enough detail to answer operational questions without creating a new bottleneck or exposing sensitive data.
📏 Little’s Law Explains Growing Queues
Little’s law is a useful operational relationship: the average number of items in a system is related to the arrival rate and the average time each item spends there. In practical terms, when requests arrive steadily and take longer to complete, more of them accumulate.
This explains why a small slowdown can create a large queue during heavy traffic. If service time rises, concurrent in-flight work rises as well; eventually workers, connections, or memory limits are reached.
Reducing service time, limiting incoming work, or increasing truly useful processing capacity can help. The law also warns against allowing unlimited concurrency, which often converts a manageable queue into resource exhaustion.
🛑 Backpressure Protects the System
Backpressure means signaling or enforcing that a component cannot accept work at the current rate. It can take the form of bounded queues, concurrency limits, rate limits, or a clear “try again later” response.
This can feel counterintuitive: why reject requests when more servers might be added? Because an overloaded system that accepts everything may spend its resources on work that will time out anyway, harming successful requests too.
Apply limits at sensible boundaries. Protect a scarce database pool, cap expensive report generation, and give users predictable feedback. Prioritize essential operations when business requirements distinguish them from background or optional work.
🤖 Autoscaling Has a Delay
Autoscaling adds or removes instances based on signals such as CPU use, request rate, queue depth, or custom application metrics. It is valuable for variable demand, but new capacity is not instantaneous.
Instances must be created, started, warmed, registered, and sometimes loaded with code or data. If scaling reacts only after CPU is already saturated, a sudden spike may finish before the extra instances can help.
Choose signals that reflect the bottleneck. CPU-based scaling fits CPU-bound services; queue-based scaling may fit asynchronous workers; request concurrency can fit I/O-heavy APIs. Set maximums, test scale events, and plan baseline capacity for expected bursts.
💸 More Servers Also Mean More Cost and Risk
Each instance consumes money, operational attention, deployment time, and capacity in shared systems. A larger fleet can generate more connections, logs, cache churn, and retry traffic.
There is also a reliability trade-off. Redundancy can make individual instance failures less consequential, yet the overall architecture gains more components to configure, monitor, patch, and secure.
Cost is not an argument against scaling. It is a reason to scale the right layer and to compare the ongoing cost of extra infrastructure with the engineering cost and benefit of reducing unnecessary work.
🧰 A Practical Bottleneck-Finding Workflow
Use a repeatable investigation rather than beginning with a hardware purchase. Start from a user-visible symptom and trace it toward the constrained resource.
- Define the affected operation and the target: latency, throughput, error rate, or all three.
- Measure the baseline under representative traffic, including percentile latency and dependency timings.
- Identify saturation or queues in application instances, databases, caches, workers, and external services.
- Form one testable hypothesis, such as “database lock waits dominate checkout latency.”
- Change one meaningful variable, retest, and verify that the intended metric improved without shifting harm elsewhere.
- Record the limit and add alerts before normal demand reaches it again.
This approach makes performance work explainable and prevents a temporary improvement from being mistaken for a general solution.
🧯 Common Scaling Mistakes
The most costly mistakes are often reasonable ideas applied without a workload model. They treat every slowdown as an application-server shortage.
- Scaling web servers while a single database query or lock dominates request time.
- Using unlimited retries, which can amplify dependency failures.
- Opening unbounded database connections from every new instance.
- Relying on average latency and missing severe tail delays.
- Autoscaling on a metric unrelated to the actual constraint.
- Introducing distributed caches or shards before understanding data access patterns.
None of these tools is inherently wrong. The mistake is applying it as a reflex rather than as a response to measured evidence.
🏗️ Design for Scale Before You Need It
Designing for scale does not mean building a complex distributed system on day one. It means preserving options: keep services reasonably stateless, make expensive operations visible, define timeouts, and avoid accidental global contention.
Good interfaces also help. An API that supports pagination, filtering, idempotency, and asynchronous job submission gives clients ways to avoid requesting unbounded work. Data models that reflect access patterns prevent predictable query pain later.
Prefer simple architecture until evidence requires more. A well-instrumented, straightforward service can be easier to optimize than a prematurely distributed system with hidden coordination costs.
🧭 Choosing the Right Next Move
Adding servers is a strong choice when application instances are genuinely saturated and each request can be served independently. It is less effective when the work converges on one shared resource or waits mostly on another system.
Ask a sequence of concrete questions: Is CPU, memory, connection capacity, storage, or a dependency saturated? Is work queued? Does each new instance create more pressure on a shared component? Can the request do less work through caching, batching, indexing, or asynchronous design?
The answers may lead to more servers, a better query, a cache, a concurrency limit, a faster dependency, or a product-level decision to defer work. Performance engineering is choosing among these based on evidence.
🎯 The Core Principle: Scale the Bottleneck
Servers are not a universal speed control. They provide additional compute and request-handling capacity, but only for the portions of a workload that can run independently and are limited by that capacity.
A fast application is usually the result of matching design to demand: parallelizing independent work, protecting scarce shared resources, observing behavior under load, and accepting that some operations require coordination.
When a bottleneck moves after an improvement, that is progress. It means the previous constraint was real; the next step is to measure again rather than assuming the same solution will continue to work.
Adding more servers makes an application faster only when those servers relieve the resource that is actually limiting useful work. Measure first, scale deliberately, and let the workload—not intuition—choose the architecture. ⚙️📈🔍