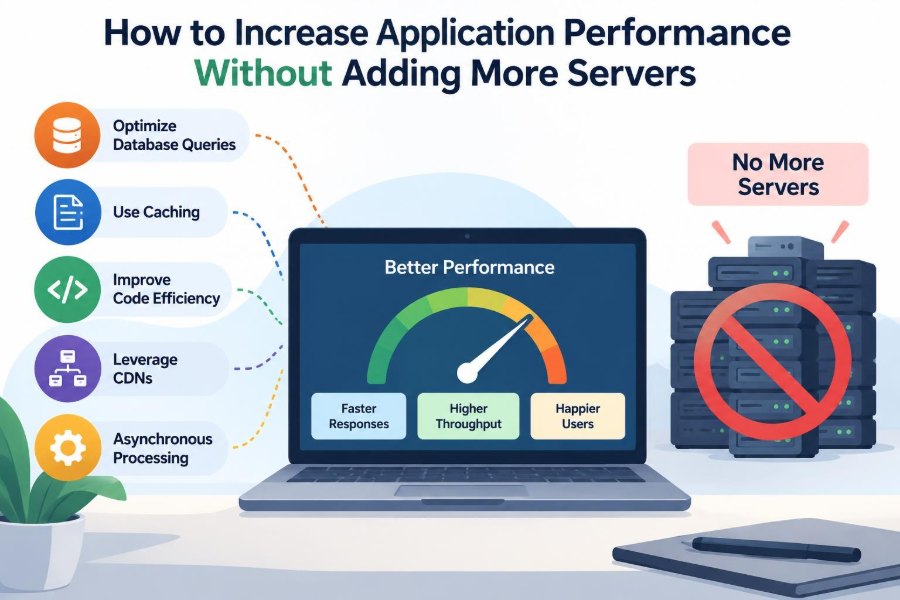

A familiar incident begins with a dashboard turning yellow. Response times climb, CPU usage rises, and someone proposes the fastest-looking fix: add another server.
Sometimes that is the right call. But scaling out can also hide a slow database query, an overloaded dependency, a blocked thread pool, or an application that repeats the same expensive work thousands of times.
More infrastructure costs money and operational effort. More importantly, it does not automatically improve the part of the system that is actually limiting throughput.
Performance work starts by finding that limiting part, then reducing or removing it. Often, the most valuable gains come from making the existing system do less work, wait less often, and use its resources more deliberately.
🧭 Start With the Real Performance Question
“The application is slow” is not yet a diagnosis. Establish what users experience: a page that takes too long to load, an API endpoint with high latency, jobs that miss a deadline, or errors that appear only during traffic peaks.
Also separate latency from throughput. Latency is the time one request takes. Throughput is the amount of work the system completes in a period. A change can improve one while damaging the other.
📏 Define a Useful Service Objective
Choose a measurable target before tuning. For example, a team might aim for most successful checkout requests to complete within a stated time while keeping error rates within an acceptable range.
Percentiles are usually more informative than averages. An average can look healthy while a meaningful share of users encounters very slow responses. Track median behavior, slower-percentile behavior, and failures together.
🔍 Measure Before You Optimize
Optimization without measurement is guesswork. Capture a baseline during representative load, including request volume, response time distribution, error rate, CPU, memory, disk activity, network activity, and dependency timings.
Then change one material thing at a time. If response time falls after a release, you want evidence that the relevant operation changed—not a coincidental drop in traffic or a warmer cache.
🗺️ Map the Request Path
Trace one request from entry to completion. It may pass through a load balancer, application code, a cache, a database, a message broker, third-party services, and storage.
Distributed tracing is particularly useful because it shows time spent in each span of work. If an endpoint takes two seconds but application code uses little CPU, the trace can reveal whether the wait is in a database call or downstream service.
🚧 Find the Bottleneck, Not the Busiest Graph
A high CPU graph deserves investigation, but it is not automatically the bottleneck. A system may show low CPU because its worker threads are blocked waiting for a saturated database connection pool.
The bottleneck is the resource or step that constrains progress under the workload that matters. Improving a non-limiting component may make a dashboard prettier without making users faster.
⏳ Understand Queueing Effects
As a resource approaches its sustainable capacity, queues grow quickly. A small increase in incoming work can create a much larger increase in waiting time, especially when requests vary in duration.
Think of one checkout lane near closing time. Even if each customer takes only a little longer, the line grows because arrivals keep coming. Keeping critical resources away from sustained saturation protects latency.
🧮 Reduce Work Per Request
The cheapest request is one that does not perform unnecessary work. Inspect each endpoint for repeated parsing, redundant permission checks, duplicated remote calls, needless object conversion, and calculations whose result is discarded.
For example, an account page might independently fetch the same profile data for its header, navigation, and content area. Fetching it once and passing the result through the request path is simpler and faster.
🧹 Remove Accidental Repetition
Repeated work often hides behind convenient abstractions. Logging large serialized objects, repeatedly reading configuration, or recalculating a value inside a loop can become expensive at high request volume.
Profile representative code rather than assuming. A tiny operation multiplied by many records, tenants, or requests can outweigh an obviously complex function that runs infrequently.
🗃️ Make Database Queries Intentional
Database work is a common constraint because each query combines network travel, parsing, locking considerations, execution, and data transfer. Begin with slow-query logs and query plans, not a guess about which index to add.
Select only the columns needed, use predicates that can benefit from indexes, and avoid retrieving large result sets merely to filter them in application code. A query plan shows how the database intends to access data; it should be interpreted in the context of real data size and distribution.
🔗 Eliminate the N+1 Query Pattern
An N+1 pattern occurs when code fetches one list and then issues an additional query for each item. A list of orders followed by one customer query per order is a classic example.
Use a join, a batch lookup, eager loading, or a purpose-built read query when appropriate. The correct choice depends on the data model, but the goal is to replace many round trips with a predictable small number.
🧷 Build Indexes for Actual Access Patterns
An index can speed reads by helping the database locate rows without scanning a large table. It is not free: indexes consume storage and can make inserts, updates, and deletes more expensive because they must also be maintained.
Design indexes around common filters, joins, and ordering requirements. Verify that the application’s query shape can use the index; an index on a column is not useful if a query transforms that column in a way that prevents efficient lookup.
📦 Avoid Moving Data You Will Not Use
Large payloads consume database, network, serialization, and client parsing time. Pagination, field selection, and response limits keep one request from becoming an unbounded data export.
For feeds and search results, cursor-based pagination can be more stable than deep offset pagination in some systems. The right approach depends on sort order, consistency needs, and how users navigate results.
⚡ Cache Stable, Expensive Results
Caching stores a result so future requests can avoid recomputing or refetching it. Good candidates include rendered configuration, product metadata, reference data, and expensive aggregate results that do not need to be perfectly current.
A cache is not a universal speed button. It introduces questions about freshness, invalidation, memory use, and behavior during misses. Define what stale data is acceptable before adding it.
🧊 Choose the Right Cache Layer
Different layers solve different costs. Browser and CDN caches can avoid reaching the application. An in-process cache avoids network travel but is local to one instance. A shared cache can serve multiple instances but adds a network dependency.
| Layer | Best fit | Main trade-off |
|---|---|---|
| Browser or edge | Public, reusable responses | Invalidation and personalization |
| Application memory | Small, local, frequently used data | Each instance has its own copy |
| Shared cache | Results needed across instances | Network cost and cache availability |
🔄 Prevent Cache Stampedes
A cache stampede happens when many requests miss or expire at once and all recompute the same expensive value. The cache then shifts a burst directly onto the database or dependency it was meant to protect.
Useful defenses include request coalescing, short randomized expiration variation, background refresh, and serving a briefly stale value when the product can tolerate it. Test the behavior when the cache is empty, not only when it is warm.
🌐 Cut Unnecessary Network Round Trips
Remote calls have fixed costs even when their payload is tiny: connection management, latency, serialization, scheduling, and potential retries. A chain of sequential calls can make a locally fast service feel slow.
Batch related reads, reuse connections safely, and remove calls whose information is already available. Do not batch indiscriminately; huge batches can increase memory use and create long-tail delays.
⚖️ Parallelize Independent Work Carefully
If two downstream reads are independent, starting them concurrently can shorten the critical path. A request that needs a profile and a feature configuration need not necessarily wait for one before requesting the other.
Parallelism has limits. More concurrent work can exhaust connection pools, increase contention, and overload a dependency. Set bounded concurrency and measure the downstream impact rather than treating parallel requests as free.
🧵 Protect Thread Pools and Event Loops
Most servers have a finite supply of threads, workers, or event-loop capacity. Blocking them on slow I/O, long synchronous computation, or locks reduces the number of requests that can make progress.
Use asynchronous I/O where the platform supports it, but do not confuse asynchronous code with unlimited capacity. CPU-heavy work still needs bounded execution, and blocking calls inside an event loop can stall unrelated requests.
🔒 Reduce Lock Contention
Locks protect shared state, but a broad lock can turn concurrent work into a single-file line. Database row locks, application mutexes, and synchronized access to shared queues all deserve attention under load.
Keep critical sections short, avoid remote calls while holding a lock, and consider partitioning shared state. Correctness comes first: removing synchronization without understanding the data race may improve benchmarks while corrupting data.
🧠 Use Memory Predictably
Memory pressure harms performance before an out-of-memory failure occurs. Excess allocation increases garbage-collection work in managed runtimes, while leaks and unbounded caches reduce room for normal request processing.
Watch heap growth, allocation rate, garbage-collection pauses, and object retention. Streaming a large response or processing records in chunks is often safer than building one giant in-memory collection.
🗜️ Treat Serialization and Compression as Trade-offs
JSON encoding, decoding, encryption, compression, and decompression all consume CPU. Compression can lower transfer time for sufficiently large, compressible payloads, but it can be a poor exchange for small responses on CPU-bound services.
Measure payload size and end-to-end timing. Reducing fields or changing response shape may achieve more than choosing a more aggressive compression setting.
📨 Move Non-Interactive Work Off the Request Path
A user should not wait for work that does not affect the immediate response. Sending a notification, generating a report, resizing an upload, or updating a search index can often run asynchronously through a durable queue.
Background work needs its own capacity controls, retries, idempotency, and monitoring. “Async” does not mean ignored; it moves the performance and reliability problem to a different path.
🛑 Set Timeouts, Limits, and Backpressure
Without timeouts, a slow dependency can occupy connections and workers until the whole application becomes unavailable. Set explicit connect, read, and overall request timeouts that reflect the operation and user experience.
Backpressure means signaling or enforcing that a system cannot accept unlimited work. Queue limits, bounded pools, rate limits, and load shedding can reject or defer some work so critical requests continue to succeed.
🔁 Retry Only When It Is Safe
Retries can help with brief transient failures, but retries also multiply load on an already struggling dependency. Retrying every failed request immediately is a common way to turn a partial slowdown into a larger outage.
Retry only operations that are safe to repeat or protected by idempotency keys. Use limited attempts, delay with jitter, and clear rules for when to stop.
🧯 Degrade Gracefully Under Pressure
Not every feature has equal value during overload. A storefront may continue checkout while temporarily omitting personalized recommendations, or an analytics dashboard may show slightly older aggregates.
Identify these choices before an incident. Graceful degradation should be intentional, visible where necessary, and designed so that missing optional data does not break the primary workflow.
🧪 Test With Representative Workloads
A synthetic test that repeatedly calls one simple endpoint may miss the mixed traffic, uneven payloads, cache misses, and slow dependencies of production. Build scenarios around important user flows and realistic data sizes.
Include failure cases: a cold cache, a delayed dependency, a full connection pool, and a burst of requests. Load testing is most valuable when it validates a specific capacity or latency hypothesis.
📈 Use Observability to Confirm Improvements
After a change, compare the same metrics used for the baseline. Look beyond a single average: examine tail latency, error rate, database load, cache behavior, queue depth, and resource saturation.
Dashboards show trends; logs explain events; traces connect work across services; profiles reveal expensive code paths. Together, they make performance work repeatable rather than anecdotal.
🧱 Avoid Premature Micro-Optimization
Replacing a clear loop with a clever low-level trick rarely matters if the endpoint spends most of its time waiting on a database. Such changes can reduce readability and make future debugging harder.
Micro-optimizations are justified when profiling shows a hot path and the change preserves correctness and maintainability. Start with architecture, data access, and unnecessary I/O because those often dominate real request time.
🛠️ Improve One Constraint at a Time
Performance tuning is iterative. Fixing one bottleneck often exposes the next: after query batching, CPU encoding may become visible; after caching, a connection pool may become the new limit.
Record the hypothesis, change, measurements, and rollback plan. This lightweight discipline helps teams learn which interventions work for their system and prevents a collection of unexplained “performance fixes.”
🤝 Make Performance a Design Habit
The best time to consider performance is while designing an endpoint, schema, or workflow. Ask how much data it reads, which dependencies it needs, what happens at peak traffic, and which work truly belongs on the synchronous path.
Code review can catch predictable risks: unbounded queries, remote calls inside loops, absent timeouts, unlimited caches, and synchronous processing of optional work. These habits cost less than emergency tuning.
🎯 Focus on the Constraint That Users Feel
Increasing performance without more servers is not about finding a single magic setting. It is a method: define the user-facing target, measure the full path, identify the limiting constraint, and change the work or waiting that creates it.
Sometimes the evidence will still support adding capacity. That decision is stronger when it follows optimization, because the additional servers are supporting a system whose true bottlenecks and safe limits are understood.
Fast applications come from doing less unnecessary work, controlling contention and waiting, and using measurement to improve the constraint that actually limits users. Build that discipline into everyday engineering, and scaling becomes a deliberate tool rather than the default reaction. ⚙️📈🚀