
A customer taps “Place order,” waits for a spinner, and sees an error. A few minutes later, the same action works. Did the system have one failure, several failures, or a brief inconvenience? The answer depends on what the engineering team measures.
Reliability is often discussed in broad terms: the service is stable, the release was risky, the platform had a bad day. Those descriptions may be directionally useful, but they do not tell a team where to act or whether a change actually helped.
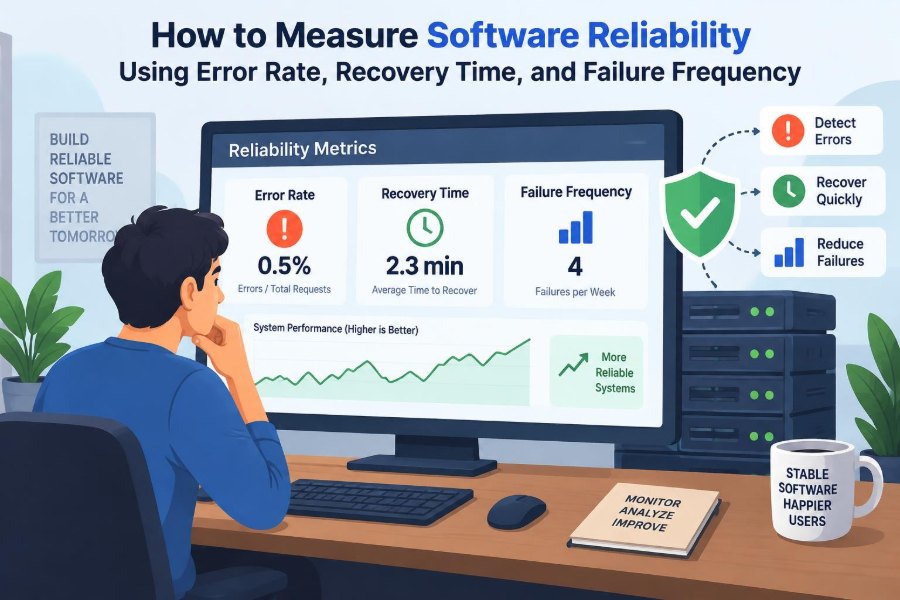
Three measures make the conversation more concrete: error rate, recovery time, and failure frequency. Together, they describe how often users encounter unsuccessful outcomes, how quickly the service returns to normal, and how often disruptive events occur.
None of these numbers can summarize reliability alone. Used carefully, however, they turn operational noise into evidence that product managers, developers, support teams, and leaders can use to make better decisions.
🧭 Start With a Practical Definition of Reliability
Software reliability is the ability of a system to deliver its intended service consistently under stated conditions for a period of time. The phrase “stated conditions” matters: a checkout API under ordinary demand, a data pipeline during its nightly batch window, and a mobile app on an unreliable network face different operating conditions.
Reliability is not the same as having no defects. A system can contain defects that users never trigger, and a nearly bug-free system can still fail because a dependency, configuration, or infrastructure component is unavailable.
Measurement should therefore focus on observable service outcomes: did the user’s request succeed, did the scheduled job complete, and did the system recover after something went wrong?
🧩 Separate Errors, Failures, and Incidents
These terms are related but should not be used interchangeably. An error is an incorrect condition, such as an exception, invalid state, timeout, or failed database query. A failure occurs when the system does not provide the expected service to a user or another system.
An incident is an operational event requiring investigation or coordinated response. One database outage may create thousands of failed requests but still be a single incident. Conversely, many brief, unrelated bugs may create several incidents with relatively few failed requests each.
This distinction prevents misleading reports. Error rate measures unsuccessful operations; failure frequency measures disruptive events; recovery time measures how long restoration takes.
📉 Calculate Error Rate From Meaningful Requests
Error rate is the proportion of measured operations that fail during a chosen time window. A common expression is:
Error rate = failed operations / total eligible operationsIf a service handles 10,000 eligible requests in an hour and 80 fail according to the team’s definition, its error rate is 0.8% for that hour. The result is useful only if “eligible” and “fail” are defined consistently.
For an HTTP API, teams often begin with server-side 5xx responses and timeouts. That is a starting point, not a universal definition. A response can return HTTP 200 while containing an application-level failure, such as a payment being declined because an internal authorization step malfunctioned.
🔢 Choose the Right Denominator
The denominator answers a deceptively simple question: out of what set of opportunities could the system have failed? Counting every request may be appropriate for a public read API, while counting completed workflow attempts may be better for an order process.
Retries require special care. If one user action produces three failed attempts and then succeeds, request-level error rate captures system strain, but user-level failure rate may show that the customer ultimately completed the task. Both views can be valid; they answer different questions.
- Request denominator: useful for endpoint and infrastructure behavior.
- Transaction denominator: useful for business workflows such as purchases or registrations.
- User-session denominator: useful when repeated errors affect one person’s experience.
Document the denominator beside the metric. A percentage without its population is easy to misinterpret.
🚦 Decide What Counts as an Error
A reliable metric needs an explicit classification policy. Client-side 4xx responses, for example, may be expected when someone submits invalid input. Counting all of them as service errors can make a healthy API appear unreliable.
Some 4xx responses still indicate a service problem. A sudden increase in authorization failures after a token-validation deployment may reflect a defect, even though the status code is technically client-facing. Likewise, a rate-limited request may be expected under documented limits but harmful if ordinary users are unexpectedly throttled.
Classify outcomes by intent and impact. Keep expected validation outcomes separate from unexpected service failures, then review unusual shifts in either category.
🕒 Measure Recovery Time, Not Just Outage Time
Recovery time measures the interval between a failure becoming service-impacting and service being restored to an acceptable condition. It is commonly summarized as mean time to recovery, often abbreviated MTTR, though organizations use that abbreviation differently.
The word “mean” can hide important variation. A team that resolves nine incidents in five minutes but one in four hours may report a reasonable average while still exposing users to an unacceptable long outage. Median and percentile recovery times provide useful additional context.
Most importantly, recovery should be measured from the user’s perspective where possible. Restarting a process is not recovery if requests still fail because the process cannot reach its database.
⏱️ Define the Recovery Clock Before an Incident
Teams need a consistent start and stop point for the recovery clock. A reasonable start might be the first confirmed moment an agreed service indicator crossed its threshold. A reasonable end might be when the indicator has returned to normal and remained stable for a defined observation period.
Several clocks can coexist:
- Detection time: from impact to discovery.
- Mitigation time: from discovery to reduced impact.
- Full recovery time: from impact to verified restoration.
Separating these stages reveals whether the main problem is monitoring, diagnosis, deployment rollback, capacity restoration, or communication. One aggregate MTTR cannot explain that by itself.
🔁 Understand Failure Frequency
Failure frequency counts how often failures or incidents occur within a period. A team might track incidents per month, failed scheduled runs per week, or user-visible disruptions per deployment.
Unlike error rate, failure frequency does not grow simply because traffic grows. If traffic doubles while the same single outage occurs, request failures may rise substantially but incident count may remain one. That is why frequency adds a different perspective.
Use a precise event boundary. A continuing incident should not become five failures merely because five alerts fired. On the other hand, two independent cache failures on separate days should not be merged because they involve the same component.
🧮 Select a Time Window That Fits the System
Short windows catch sudden spikes but can be noisy when traffic is low. Long windows smooth noise but can delay recognition of a worsening service. The right window depends on request volume, user expectations, and the operational decision the metric supports.
A busy API may need one-minute and five-minute views for alerting, plus weekly and monthly views for planning. A monthly payroll process may be better measured per run, because its most meaningful failure opportunity happens only at scheduled intervals.
Compare equivalent periods when possible. Weekday business traffic, seasonal campaigns, and overnight batch processing can have very different baseline behavior.
🔗 Read the Three Metrics Together
Error rate, recovery time, and failure frequency describe different dimensions of service reliability. A high error rate with a short recovery time may indicate a sharp but well-contained deployment problem. A low error rate with a long recovery time may signal a rare but severe dependency outage.
| Metric | Primary question | What it can miss alone |
|---|---|---|
| Error rate | How many operations failed? | Whether failures came from one event or many |
| Recovery time | How quickly was service restored? | How many users or operations were affected |
| Failure frequency | How often did disruptions occur? | The severity and duration of each disruption |
The combined pattern is more informative than a single “reliability score.” Resist collapsing every signal into one number unless the assumptions behind that score are explicit and useful.
🎯 Connect Metrics to Service Level Indicators
A service level indicator (SLI) is a measured signal about service behavior. Examples include the proportion of successful requests, the proportion of jobs completed before a deadline, or the latency experienced by users.
Error rate is often the inverse of a success-rate SLI. Recovery time and incident frequency usually complement that SLI by explaining operational behavior when the success signal deteriorates.
Choose SLIs that reflect what users value. A search response that returns quickly but omits all results is not successful merely because its HTTP status is 200. Instrument the actual promise of the service, not only its technical transport layer.
📏 Use Objectives as Decision Boundaries
A service level objective (SLO) is a target for an SLI over a defined period. It gives teams a boundary for deciding when to investigate, slow releases, invest in resilience, or accept normal variation.
An SLO should not be copied blindly from another organization. A back-office reporting tool, an internal developer platform, and an emergency communication service may reasonably require different targets because their consequences differ.
For example, a team might set an objective around successful completed checkouts rather than individual API calls. The objective becomes meaningful when it represents a real expectation and when the team has authority to improve the service if it is missed.
📡 Instrument the User Journey
Server metrics are essential, but they can miss failures that occur before a request arrives or after a response leaves the server. Mobile clients may lose connectivity, browsers may fail to load a script, and a queue consumer may never process an accepted request.
Instrument important journey steps: initiated, accepted, processed, completed, and confirmed. Correlation IDs can connect those steps across services, letting engineers see whether an apparent timeout was a gateway issue, a slow dependency, or a processing failure after acceptance.
Collect only the data necessary for reliability analysis, and treat identifiers and payloads carefully. Operational visibility should not become an excuse to collect sensitive user data without a clear purpose.
🪵 Combine Metrics, Logs, and Traces
Metrics show that a problem exists and how broadly it is occurring. Logs provide event details, while distributed traces show the path of a request through multiple services. Each tool answers a different investigative question.
A rising error-rate graph may reveal that failures began immediately after a release. A trace may then identify a slow call to inventory, and structured logs may expose a connection-pool exhaustion message.
Make telemetry consistent. Include timestamps, operation names, outcome categories, version identifiers, and correlation IDs where appropriate. Without shared fields, engineers spend valuable recovery time manually matching fragments of evidence.
🧹 Protect Metrics From Bad Data
Reliability measurements are only as credible as their input data. Duplicate events, missing telemetry during an outage, inconsistent status labels, and clock skew can all distort the result.
Monitoring systems can fail too. If an agent stops reporting while the application is unhealthy, a dashboard may show an artificial improvement. Independent synthetic checks, which periodically simulate a basic user action, can help detect this blind spot.
Build validation into the measurement pipeline. Compare request counters with access logs, test alert paths, and investigate sudden drops in traffic as seriously as sudden rises in errors when a drop is unexpected.
🗺️ Segment Results Before Drawing Conclusions
An aggregate error rate can conceal a serious localized problem. A global 0.2% error rate may be acceptable in context, while one region, application version, payment method, or customer tier experiences a much worse outcome.
Segment by dimensions that can reveal actionable differences:
- API endpoint, workflow step, or job type
- Region, availability zone, or network path
- Application version and deployment cohort
- Dependency, database shard, or third-party provider
Segmentation has a cost: too many dimensions create sparse, noisy charts. Start with known architectural boundaries and user journeys, then add detail when it supports a decision.
🛒 Walk Through a Hypothetical Checkout Incident
Imagine a fictional online store whose checkout completion rate falls shortly after a payment-library deployment. The API-level error rate rises because authorization calls time out. The team rolls back the library, and successful checkouts return to normal after 18 minutes.
This event might be recorded as one incident, a burst of failed checkout operations, and an 18-minute recovery time. If retries caused some customers to submit multiple attempts, request errors could exceed the number of customers ultimately unable to purchase.
The useful follow-up is not merely “MTTR was 18 minutes.” The team should ask why the issue escaped pre-release testing, how quickly the change was detected, whether rollback was safe, and how many completed checkouts were affected.
🌐 Relate Reliability to Availability Carefully
Availability usually describes the proportion of time or requests for which a service is usable. Reliability is broader: it includes consistency, correct behavior, and recovery from failures. A service can be technically available but unreliable if it frequently returns incomplete or incorrect results.
Time-based availability can also mislead for low-traffic systems. Ten minutes of downtime at 3 a.m. and ten minutes during a major transaction window are not equivalent from a user-impact perspective. Request-based or transaction-based measures may better capture that difference.
Use availability as one useful lens, not as a substitute for outcome-based error measurement and recovery analysis.
⚖️ Account for Severity and User Impact
Not every failure deserves the same operational response. A cosmetic image-loading failure and an inability to submit emergency information may both count as failed operations, but their consequences are different.
Define severity through impact: affected workflows, breadth of users, data integrity risk, financial or contractual consequences, and availability of workarounds. Severity labels should support prioritization, not obscure raw evidence.
A weighted score can help summarize varied failures, but it must be designed cautiously. Weighting introduces judgment, so retain the underlying counts and rates. A polished score should never hide a small number of high-impact failures.
🔔 Design Alerts for Action, Not Attention
An alert should indicate a condition someone can investigate or mitigate. Alerting on every individual exception creates noise, encourages alert fatigue, and can make the genuinely urgent signal easier to miss.
Combine magnitude and duration when practical. A brief error spike during a deploy may be tolerable, while a smaller sustained error rate can be more harmful. Alerts can also consider minimum traffic so that one failed request does not wake a team for a low-volume service.
Every alert needs an owner, a response expectation, and enough context to begin diagnosis. If no action follows an alert repeatedly, adjust or retire it.
📈 Learn From Trends Rather Than Single Points
One bad day may result from a rare external event. A gradual upward trend in failure frequency or recovery time can reveal accumulating operational debt: growing data volumes, dependency saturation, fragile manual procedures, or increasingly complex releases.
Plot metrics over enough time to see normal variation. Annotate deployments, infrastructure migrations, traffic campaigns, and dependency incidents. Annotations turn a chart from a passive report into a tool for testing plausible explanations.
Be careful with correlation. If errors rise after a release, the release is a strong lead, not automatic proof. Confirm with logs, traces, rollback behavior, controlled comparison, or other evidence.
🧪 Measure the Effect of Changes
Reliability work should have a feedback loop. When a team adds retry backoff, database indexes, circuit breakers, canary deployment, or automated rollback, define in advance which signals should improve and what trade-offs might appear.
For example, aggressive retries may lower visible user failures but increase downstream load and extend recovery during an outage. A cache can reduce latency and error exposure but introduce stale-data behavior that must be acceptable for the feature.
Compare before-and-after periods with similar demand where possible, and keep the operational context visible. Measurement is most useful when it challenges assumptions about a proposed fix.
🧱 Treat Dependencies as Part of the Service
Users do not care which component failed; they care whether the promised task worked. Databases, DNS, identity providers, message queues, cloud services, and external APIs are therefore part of the effective reliability boundary.
Track dependency-specific error and latency signals alongside end-to-end outcomes. This helps distinguish “our checkout is failing” from “our checkout is correctly surfacing a payment-provider outage.” Both require user-impact management, but the mitigation options differ.
Where appropriate, design graceful degradation: queue non-urgent work, serve cached data, disable an optional feature, or offer a clear retry path. Degradation is only a reliability improvement when it preserves a meaningful and safe user outcome.
🧯 Avoid Common Measurement Mistakes
Several mistakes recur because the metrics sound simpler than the systems they describe:
- Counting log exceptions as user failures without checking whether requests succeeded.
- Using averages alone and hiding long recovery events.
- Changing metric definitions without marking the dashboard or preserving comparability.
- Counting alerts instead of distinct failure events.
- Ignoring successful retries and duplicate client requests.
- Reporting a global average while one critical workflow is severely affected.
The solution is not endless instrumentation. It is a small set of clearly defined measures, reviewed against real incidents and refined when they no longer reflect user experience.
📝 Build an Incident Review Around Evidence
After a meaningful incident, record the timeline, impact, error pattern, recovery stages, contributing conditions, and follow-up actions. The purpose is learning and system improvement, not finding an individual to blame.
Include the measurements used during the response. Did the error rate detect the problem? Did a recovery-time gap come from slow diagnosis or a difficult rollback? Was the incident count inflated by duplicate alerts? These questions improve both the service and the measurement system.
Action items should be concrete: add an end-to-end check, reduce a manual failover step, test a dependency fallback, or make a deployment reversible. “Be more careful” is not an engineering control.
👥 Make Reliability Reporting Useful to Different Audiences
Engineers need detailed breakdowns, traces, component behavior, and operational timelines. Product and support teams often need workflow impact, customer symptoms, workarounds, and expected restoration. Leaders need trends, risk, investment choices, and whether objectives are being met.
Use the same underlying definitions while changing the level of detail. A concise monthly summary can report failure frequency, recovery-time distribution, major affected journeys, and the status of reliability improvements. Engineers can then drill into the relevant evidence.
Transparent reporting builds trust when it includes limitations. Say when a metric excludes client-side failures, when traffic was unusually low, or when a definition changed.
💡 Improve Reliability Through a Continuous Loop
Measurement is not the final activity after building software. It is part of a continuous loop: define expected outcomes, instrument them, observe normal behavior, detect deviations, mitigate impact, learn from failures, and change the system.
Small, frequent improvements often matter more than a distant goal of perfect uptime. Better timeouts, safer defaults, clearer runbooks, dependency isolation, tested restores, and simpler deployment paths can each reduce errors, shorten recovery, or prevent repeated incidents.
Prioritize work where the three measures and user impact point in the same direction. A frequent failure that takes a long time to recover from and disrupts a critical journey is a stronger candidate than a rare, low-impact warning.
✅ Bring the Measures Back to the User
Error rate tells you how often the service did not produce the expected result. Recovery time tells you how long users remained exposed after a disruption began. Failure frequency tells you whether disruptions are becoming a recurring pattern.
Used together, these measures support better questions: Which journeys fail? Who is affected? What changed? How quickly can the team restore service? Which safeguards would reduce the next failure’s impact?
The central principle is straightforward: measure reliability at the point where software meets its promise to users, then use the evidence to improve the system rather than merely explain its past failures.
Reliable software is not defined by a single impressive number; it is built by observing failed outcomes honestly, restoring service quickly, and reducing the conditions that let failures recur. ⚙️📊🛠️