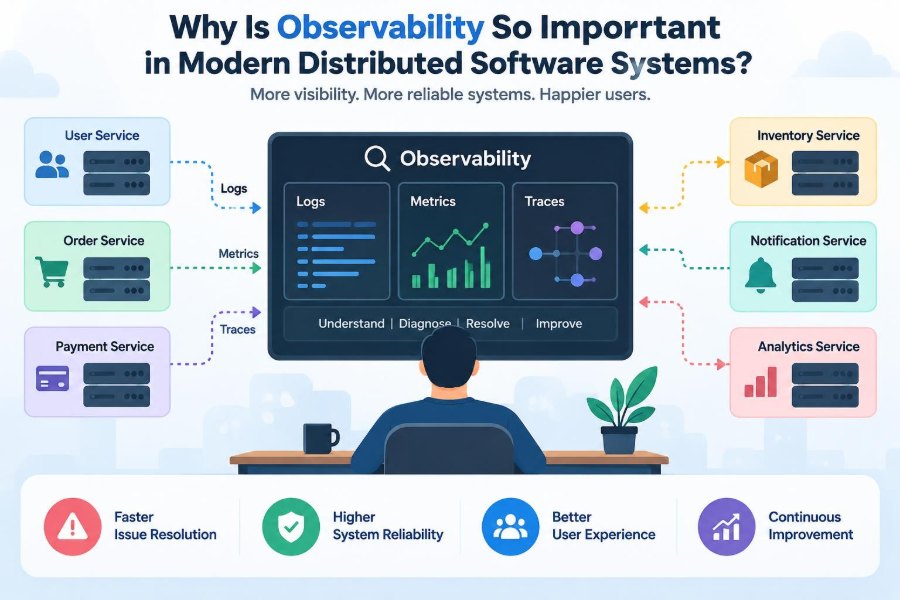

A customer opens a shopping app, adds an item to a cart, and taps “Pay.” The screen spins. A minute later, support receives a report that the payment failed—but the customer’s bank shows a pending charge. Is the problem in the app, the payment provider, the inventory service, a database connection pool, or a retry that ran at the wrong time?
In a small application running on one server, an engineer might inspect a log file and find the answer. Modern systems are rarely that simple. One user action can cross dozens of services, queues, caches, databases, and third-party APIs, often deployed across many machines or cloud regions.
When something goes wrong, teams need more than a message saying “error.” They need to understand what the system is doing internally from the evidence it produces. That capability is called observability.
Observability is not just a tool purchase or a dashboard project. It is an engineering practice that makes complex software easier to operate, debug, improve, and trust.
🔭 Observability Means Inferring Internal State
In control theory, a system is observable when its internal state can be inferred from its external outputs. In software, the “outputs” are operational signals: measurements, event records, request paths, deployment information, and other context.
An observable service lets an engineer ask useful questions without already knowing the exact failure mode. For example: “Which tenant is affected?”, “What changed before latency rose?”, or “Where did requests begin waiting?”
This is a stronger goal than merely collecting data. A system can produce enormous volumes of telemetry while still being difficult to understand if its signals are incomplete, disconnected, or poorly labeled.
🧩 Distributed Systems Hide Cause and Effect
A distributed system spreads work among independent components that communicate over a network. That design enables scale and team autonomy, but it removes the straightforward, local path from symptom to cause.
Suppose an order service is slow. The order service may be healthy by its own measures, yet waiting on inventory. Inventory may be waiting on a database, whose connection pool is exhausted because a reporting job started earlier. The visible failure is far from the initiating event.
Networks also introduce timeouts, partial failures, retries, duplicated messages, and inconsistent clocks. Observability provides the evidence needed to reconstruct these chains rather than guessing at them.
🗺️ Architecture Has Become More Dynamic
Containers, serverless functions, autoscaling groups, and short-lived test environments mean that machines and processes appear and disappear constantly. An engineer cannot rely on logging into a familiar host and inspecting a long-running process.
Service ownership can also be distributed among several teams. A request may pass from a web application to an API gateway, several internal services, and an external provider. The architecture is a moving system, not a fixed diagram.
Good observability captures relationships dynamically: which version handled a request, which dependencies it called, and which environment or region was involved.
📊 The Core Signals: Metrics, Logs, and Traces
The familiar “three pillars” are metrics, logs, and traces. Each answers a different kind of question, and their value increases when teams can navigate between them.
| Signal | Best for | Example question |
|---|---|---|
| Metrics | Trends, rates, counts, and alerting | Did error rate rise after deployment? |
| Logs | Detailed events and diagnostic context | Why did this request fail validation? |
| Traces | Following work across components | Which downstream call made checkout slow? |
These categories overlap in practice. A structured log can be turned into a metric, and trace data can provide timing aggregates. The useful distinction is not dogma; it is choosing evidence that fits the question.
📈 Metrics Reveal Patterns at Scale
A metric is a numerical measurement captured over time, such as requests per second, queue depth, memory use, or failed jobs. Because metrics are compact and easy to aggregate, they are well suited to dashboards and alerts.
For a public API, a team may track request rate, error rate, and latency. A sudden change answers a crucial first question: is there a broad pattern, or is this an isolated report?
Metrics rarely explain the entire cause. An elevated error count tells you that a problem exists, but not necessarily which user input, dependency response, or code path produced it.
🧾 Logs Preserve the Details
Logs record discrete events: a request was rejected, a job completed, a cache lookup missed, or an exception occurred. They are especially useful when engineers need the exact error message or business context surrounding a specific operation.
Logs become much more useful when they are structured. Instead of a sentence that must be parsed by a human, a structured event can include consistent fields such as request_id, order_id, service, status_code, and error_type.
Care is essential. Logs should not casually contain passwords, authentication tokens, full payment details, or unnecessary personal information.
🧵 Traces Follow a Request End to End
A distributed trace represents the journey of one operation through a system. It is composed of spans, where each span describes a unit of work such as an HTTP request, database query, queue publish, or remote procedure call.
Parent-child relationships between spans create a timeline. In a hypothetical checkout trace, engineers might see that the checkout service spent most of its time waiting for a tax calculation API rather than processing its own code.
Tracing is especially valuable because it connects a user-visible experience to the internal dependencies that shaped it. It turns “checkout is slow” into a path that can be inspected.
🔗 Correlation Connects Separate Clues
Signals are most useful when they share identifiers. A trace ID propagated across services can appear in logs, while a deployment version and region can label metrics. This correlation lets engineers move from a spike on a chart to the affected traces and then to the relevant log events.
Without it, incident response becomes a manual matching exercise across timestamps and service names. That is slow and error-prone, particularly when many requests occur at once.
Correlation needs deliberate design. Every service boundary—HTTP calls, asynchronous messages, background jobs—must preserve or create the appropriate context.
⏱️ Latency Is More Than One Number
Average latency can look healthy while a meaningful minority of users experience long delays. Averages smooth away the extremes that often matter most in interactive systems.
Percentiles provide a better view. The 95th percentile, for example, describes the latency below which most requests fall while drawing attention to the slower tail. Teams must still interpret percentiles carefully: an aggregate can hide a slow endpoint, customer segment, or region.
Traces explain whether latency comes from application work, lock contention, network waiting, a database query, or a dependency. Measuring and explaining are complementary tasks.
🚨 Alerts Should Protect Users, Not Wake Teams for Noise
An alert is an interruption, so it should correspond to a condition requiring human attention. Alerts based solely on low-level host thresholds often create noise without showing whether users are actually harmed.
More meaningful alert conditions connect to service behavior: sustained failures of a critical operation, rising request latency beyond an agreed objective, or a queue growing faster than workers can process it.
Alerts need runbooks too. A useful alert identifies the affected service, provides a starting dashboard or query, and states the first safe checks. An alarm with no context transfers uncertainty to whoever is on call.
🎯 Service Level Objectives Create Operational Focus
A service level objective, or SLO, is a target for a user-relevant measure over a time window. For example, a team may define a target for successful API responses or timely processing of uploaded files.
The gap between the target and actual performance is often discussed as an error budget. It frames reliability as a managed trade-off: if the service is meeting its target comfortably, the team may accept more delivery risk; if it is consuming the budget quickly, reliability work deserves priority.
SLOs do not eliminate judgment. They work best when based on meaningful user journeys rather than convenient infrastructure counters.
👤 Start with the User Journey
Infrastructure telemetry matters, but users experience outcomes: signing in, placing an order, receiving a notification, or viewing a report. Observability should begin by identifying these critical journeys and their success conditions.
A background worker might have normal CPU and memory while an important queue accumulates because one message type fails repeatedly. From the user’s perspective, the system is not healthy, even if every server appears available.
This perspective helps teams choose telemetry that reveals whether work was completed, not merely whether software was running.
🧱 Dependencies Are Part of Your Service
A service may be well implemented yet still fail because its database, identity provider, cloud service, or payment gateway is slow or unavailable. Users do not distinguish between your code and a dependency when their task cannot finish.
Dependency observability should capture call rate, errors, latency, timeout behavior, and fallback usage. Traces can show which dependency was involved, while metrics reveal whether the behavior is widespread.
Third-party systems may expose limited diagnostics. In that case, record what your application can observe: request timing, response category, retry count, and circuit-breaker state.
🔁 Asynchronous Work Needs Its Own Visibility
Not all work happens in the lifetime of a web request. Queues, streams, scheduled jobs, and event-driven functions improve resilience and throughput, but they make the path less visible.
A “successfully queued” response does not prove that a task was completed. Teams need to observe queue depth, message age, processing rate, failures, retry attempts, and dead-letter destinations where unprocessable messages are held.
Trace context can sometimes cross asynchronous boundaries, but implementation varies. At minimum, a stable operation or message identifier should make producer and consumer events searchable together.
🧪 Observability Supports Safer Releases
A deployment is a change to a running system, and observability is how teams assess its effect. Version labels in metrics, logs, and traces help compare behavior before and after a release.
During a gradual rollout, engineers can watch whether the new version has a different error profile, resource demand, or latency pattern. A quick rollback is valuable, but it is more effective when evidence identifies which change is behaving differently.
Feature flags deserve the same treatment. A flag may change database load or request paths even when no new binary is deployed.
🕵️ Incident Response Becomes Investigation, Not Guesswork
During an incident, time is often lost switching among disconnected dashboards, command-line sessions, and team chat messages. Clear telemetry shortens the path from a reported symptom to a bounded hypothesis.
A disciplined investigation might begin with the user-facing symptom, identify affected endpoints and regions, compare a healthy time period, inspect representative traces, and validate the leading hypothesis against logs and dependency signals.
Observability does not guarantee a fast answer. Novel failures and ambiguous evidence still occur. It does, however, replace unsupported hunches with testable explanations.
📚 Post-Incident Learning Needs Evidence
The goal of a post-incident review is not to find someone to blame. It is to understand conditions, decisions, safeguards, and system behavior well enough to reduce recurrence or reduce impact.
Historical metrics reveal when a trend began. Traces expose affected paths. Logs add the specific context needed to distinguish a trigger from a contributing factor. Together, they support an accurate timeline.
A useful outcome may be a code change, a clearer alert, a missing dashboard, a better rollback procedure, or additional capacity. Often it is several of these, because operational failures are rarely caused by one isolated mistake.
🔒 Telemetry Can Create Privacy and Security Risks
Observability data is powerful because it is detailed, which also makes it sensitive. Request bodies, query strings, account identifiers, tokens, and internal topology can create privacy or security exposure if collected or broadly accessible.
Teams should define what fields are allowed, redact or tokenize sensitive values, restrict access by role, encrypt data in transit and at rest where appropriate, and set retention periods that match operational needs.
“Log everything” is not a mature strategy. Collect enough context to investigate responsibly, then treat telemetry as production data with real governance requirements.
💸 High-Cardinality Data Has a Cost
Cardinality describes how many unique values a field or metric label can have. Labels such as HTTP method or response class have bounded values. Labels such as email address, full URL path, or request ID may produce a nearly unique value for every event.
High-cardinality data is often useful in logs and traces, where individual investigation is expected. Used indiscriminately in metrics, it can create excessive storage, expensive queries, and monitoring systems that struggle under their own data volume.
Choose dimensions intentionally. Aggregate metrics around stable operational questions, and retain detailed identifiers in event data with appropriate sampling and access controls.
🎲 Sampling Requires Careful Trade-Offs
Tracing every request can be costly in busy systems. Sampling selects only some telemetry for storage or analysis, reducing expense and overhead.
Simple random sampling may miss rare failures—the very cases engineers need most. A more useful approach may keep all errors, unusually slow requests, and selected high-value workflows while sampling routine successful traffic.
Sampling changes what can be concluded from data. Teams should document the policy and avoid treating sampled traces as a complete record of every request.
🧭 Context Must Be Consistent Across Services
Different teams often build services with different frameworks and conventions. If one service calls a user identifier customer_id, another uses account, and a third logs no identifier at all, cross-service investigation becomes difficult.
A lightweight semantic convention helps. Standardize common fields for service name, environment, deployment version, region, operation, outcome, and correlation identifiers. Keep the standard practical enough that teams will actually apply it.
Consistency does not require every event to contain every field. It means that shared concepts have predictable names and meanings where they are relevant.
🛠️ Instrumentation Is a Product Decision
Automatic instrumentation from frameworks can provide useful baseline data for incoming requests, database calls, and common client libraries. It is a fast starting point, not a complete model of the business.
Manual instrumentation adds domain-specific meaning: whether an order was authorized, whether an invoice was generated, why a workflow took a fallback path, or which stage rejected a document. These are often the questions support and product teams actually need answered.
Add instrumentation at important boundaries and decisions. Avoid adding spans or log lines to every tiny function; excessive detail can obscure the story and add overhead.
🧰 Good Dashboards Answer Specific Questions
A dashboard full of colorful charts can look reassuring while offering little help during an outage. Effective dashboards are organized around a question, audience, or decision.
- An executive service view may show availability, latency, traffic, and error-budget status.
- A service-owner view may add endpoints, dependencies, saturation, and recent deployments.
- An incident view may prioritize active alerts, comparisons with baseline behavior, and direct paths to traces and logs.
Dashboards should evolve after incidents. If responders repeatedly need a query that is missing, that is a concrete signal to improve the operational interface.
📉 Avoid Monitoring Only Infrastructure
CPU, memory, disk, and network indicators remain useful. They can identify saturation, resource leaks, or noisy-neighbor effects. But they are symptoms and constraints, not complete definitions of service health.
A service can return errors with low CPU because a dependency is rejecting requests. Conversely, high CPU may be acceptable during a predictable batch workload if users are unaffected and capacity remains available.
Combine infrastructure measures with request outcomes, queue behavior, dependency health, and user-facing objectives. This prevents teams from optimizing what is easy to measure instead of what users need.
🧯 Common Failure Modes in Observability Programs
Many observability efforts disappoint for organizational reasons rather than technical ones. Tools may be installed, but ownership, naming, retention, and incident practices remain unclear.
- Data without questions: collecting every available signal without deciding what decisions it should support.
- Alert fatigue: thresholds trigger frequently but do not identify actionable user impact.
- Broken context propagation: traces end at service or queue boundaries.
- Uncontrolled cost: verbose logs and unbounded metric labels grow without review.
- Stale dashboards: views describe an architecture that no longer exists.
The remedy is ongoing engineering discipline, not a one-time implementation sprint.
🚀 A Practical Adoption Path
Teams do not need perfect telemetry before gaining value. Start with a critical user journey and make its normal and failed behavior visible.
- Define the outcome that matters, such as completed payment or processed document.
- Instrument request rate, failures, and latency for the responsible service.
- Add structured logs with safe, searchable context.
- Propagate correlation and trace context through major dependencies.
- Create one operational dashboard and a small number of actionable alerts.
- Review real incidents and improve the gaps they expose.
This sequence avoids a common trap: building a broad platform before proving which signals help people make decisions.
🤝 Observability Is a Shared Responsibility
Developers understand code paths and domain decisions. Site reliability and platform engineers often provide telemetry platforms, reliability practices, and operational expertise. Security and privacy teams help set safe handling rules. Support teams see customer symptoms that dashboards may miss.
Useful observability emerges when these perspectives meet. Developers should be able to investigate the services they build, while shared platforms reduce duplicated effort and establish safe defaults.
Ownership should include keeping telemetry current as services, schemas, and dependencies change. An abandoned dashboard is technical debt just as surely as an unmaintained library.
⚖️ More Data Is Not Always Better
There is a genuine trade-off between detail, cost, performance, privacy, and human attention. Capturing every payload and every internal operation may be expensive, risky, and difficult to navigate.
The right amount of observability depends on the system’s criticality, traffic, failure modes, regulatory context, and operational maturity. A small internal tool and a payment workflow should not necessarily have identical policies.
The practical standard is purposeful evidence: enough trustworthy context to detect meaningful problems, investigate them efficiently, and verify that improvements worked.
🌟 The Core Principle: Make Behavior Explainable
Modern distributed software cannot be operated confidently as a collection of black boxes. Failures cross boundaries, releases alter behavior, and user experiences depend on components no single team fully controls.
Observability makes system behavior explainable. Metrics identify patterns, logs preserve context, traces reveal paths, and correlation turns separate signals into an investigation. SLOs and user journeys ensure that this evidence remains connected to outcomes that matter.
Its deepest value is not simply faster debugging. It gives teams a more accurate mental model of the systems they change, operate, and depend on every day.
Observability matters because reliable distributed software depends on evidence, not assumptions. Build that evidence around real user outcomes, preserve context across boundaries, and keep improving it whenever the system teaches you something new. 🔭⚙️📊