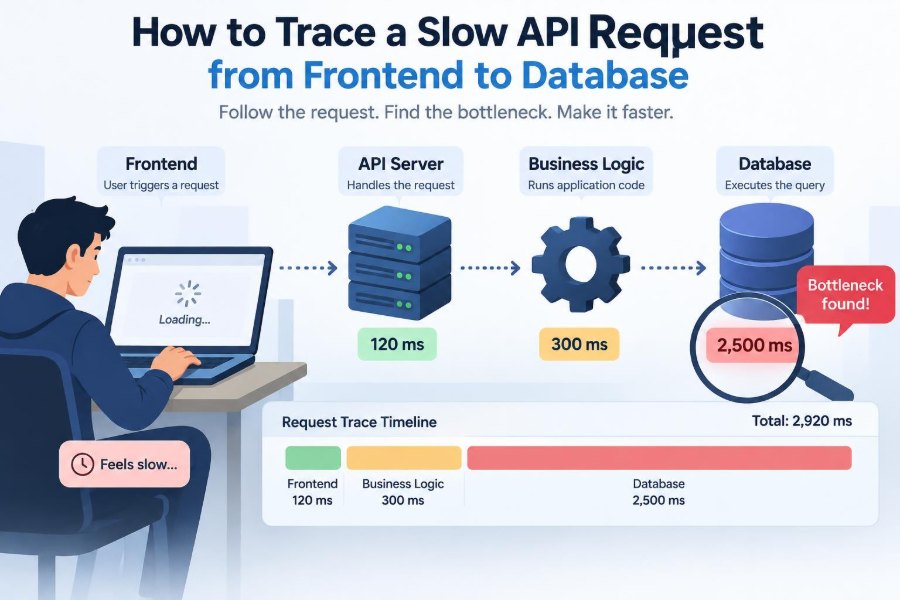

A page feels slow. A user clicks “Search,” waits several seconds, and sees a spinner that offers no clue about what is happening. The frontend team suspects the API. The backend team suspects the database. The database team asks for the query.
This situation is common because a single API request is not a single operation. It is a journey through a browser, networks, gateways, application code, caches, queues, database connections, queries, and a response path back to the screen.
Guessing at the slowest layer often creates busywork: adding an index for a request that never reached the database, rewriting frontend code when a gateway was retrying calls, or tuning a fast query whose connection waited in a saturated pool.
The reliable alternative is tracing: follow one request with evidence, measure each meaningful stage, and narrow the bottleneck before changing anything. This approach works whether the issue affects one endpoint, one customer, or the entire service.
🧭 Treat the Request as a Journey
An API latency number is an outcome, not a diagnosis. If a client reports 2.4 seconds, that time may include browser work before sending, network transfer, server processing, a database wait, and browser work after the response arrives.
Think of the request as a parcel moving through a delivery network. Knowing that delivery took two days does not identify whether the delay occurred at pickup, a sorting center, customs, or the final mile. Trace data creates the equivalent timeline.
Your first job is to identify where elapsed time accumulates. Only then can you decide whether to optimize code, capacity, a query, a dependency, or the user experience.
🎯 Define “Slow” Before Investigating
“Slow” should be stated in measurable terms. Is the concern the median response, occasional very long requests, or an endpoint that is consistently sluggish under load? These are different failure patterns.
Record the endpoint, HTTP method, environment, time range, affected users, response status, and client context. A request that is slow only on a mobile connection requires a different investigation from one that is slow inside a data center.
Percentiles are useful because averages can hide painful outliers. The p95 is the response time at or below which 95% of observations fall; it helps reveal the slower tail without focusing solely on the single worst request.
🧩 Map the End-to-End Path
Draw the actual path before collecting more tools or logs. Modern applications frequently have more hops than developers remember: a CDN, web application firewall, load balancer, API gateway, service mesh proxy, several internal services, Redis, a message broker, and a primary database.
For a typical interactive request, the map may look like this:
Browser → DNS/CDN → Load balancer → API gateway → Application
        → Cache → Database → Application → Gateway → Browser
Mark optional branches too. A cache miss may invoke the database; a feature flag may call a remote service; a retry may produce two database queries even though the user made one click.
🏷️ Give Every Request a Trace Identity
A request ID is a unique value attached to a request and carried through logs. It lets you find related events across components. A distributed trace ID goes further by connecting operations into a trace made of spans, where each span represents timed work such as an HTTP call or SQL query.
Generate or accept the ID at the system edge, then propagate it on outbound HTTP headers, asynchronous messages, and relevant database instrumentation. Do not create unrelated IDs at every hop without preserving the parent relationship.
Common tracing conventions use headers such as traceparent. The exact format matters less than consistent propagation. Without continuity, individual logs can look healthy while their combined request is slow.
📏 Measure from the User’s Perspective First
Browser developer tools provide the first concrete boundary. In the Network panel, inspect a slow request’s start time, duration, status, request headers, response headers, and timing breakdown when available.
Browser timing can expose DNS lookup, TCP or TLS connection setup, request upload, waiting for the first byte, and response download. “Waiting” is often reported as time to first byte, but it is not purely server execution: network distance and intermediaries also contribute.
Capture the request ID and any server timing headers. This creates a bridge from the user’s observation to server-side telemetry instead of relying on a separately reproduced request.
🖥️ Separate UI Delay from API Delay
A slow-looking screen does not always mean a slow API. The browser may delay dispatch while JavaScript performs expensive work, a request may be blocked by connection limits, or the response may arrive quickly but trigger costly rendering.
Use the browser performance timeline to compare click time, request start, response completion, JavaScript processing, and paint. For example, an API that completes in 180 ms can still produce a slow screen if a large result is transformed synchronously on the main thread.
Conversely, a spinner that starts immediately does not prove the frontend is innocent. It only proves that the user-visible wait has begun.
🌐 Check Network and Edge Behavior
Before entering application code, inspect the layers at the edge. A CDN might serve a cache hit quickly while cache misses travel to origin. A web application firewall may inspect a request, and an API gateway may apply authentication, quotas, routing, or transformations.
Compare edge duration with origin duration when those measurements exist. If the gateway sees a long upstream time, investigate the service. If the gateway itself spends time before forwarding, investigate policies, connection reuse, regional routing, or capacity there.
Do not assume a nearby client has a nearby origin. Geography, DNS resolution, VPNs, and cross-region routing can make network delay a material part of the experience.
🔁 Rule Out Retries and Redirects
A request can appear as one user action but become multiple operations. The browser may follow a redirect. A gateway, HTTP client, or SDK may retry after a timeout or transient failure. A service may repeat a call because an acknowledgement was lost.
Retries can improve resilience, but they also amplify load when a dependency is struggling. A three-attempt retry policy can turn a short incident into a flood of duplicate work.
Look for repeated trace spans, redirect status codes, retry counters, and identical operations close together. Confirm whether retries are safe: repeating a read is usually different from repeating a payment or a record creation.
⏱️ Use Server Timing as a Simple Boundary Tool
The Server-Timing response header can expose selected backend timings to browser tooling. An application might report durations for cache lookup, application work, and database access.
Server-Timing: app;dur=42, db;dur=18, cache;dur=2This is not a replacement for distributed tracing, but it quickly answers a valuable question: did the server spend most of the request inside its own processing, or is the observed delay elsewhere?
Expose only safe, coarse measurements. Avoid sending raw SQL, customer identifiers, internal hostnames, or operational details that should remain server-side.
📜 Start with Structured Application Logs
Structured logs store fields rather than embedding every fact in an unstructured sentence. At minimum, log the trace or request ID, route, method, status, total duration, and deployment version.
For meaningful slow requests, include useful context such as authenticated tenant class, cache outcome, database operation count, downstream dependency name, and timeout or retry status. Be deliberate about privacy: do not log passwords, authorization tokens, or sensitive request bodies.
A log line saying “request completed in 2200 ms” is a clue. A structured record that says 1,900 ms was spent awaiting an inventory service is a direction.
🔗 Read a Distributed Trace as a Timeline
A distributed trace groups spans into a parent-child tree. The top span is usually the inbound request. Beneath it are child spans for middleware, service calls, cache operations, queries, and other instrumented work.
Look first for the critical path: the sequence of dependent spans that determines when the request can finish. A trace may contain many spans, but parallel work should not be added together as though it happened sequentially.
If two 300 ms calls run in parallel, they contribute roughly 300 ms to wall-clock latency, plus coordination overhead—not 600 ms. Trace visualizations help distinguish parallel fan-out from serial waiting.
🧱 Find Gaps Between Instrumented Spans
Large gaps in a trace are evidence too. If an inbound request span lasts 1.5 seconds but visible child spans total 100 ms, the missing time may be uninstrumented application code, middleware, thread scheduling, garbage collection, lock contention, or a dependency that lacks tracing.
Add narrow instrumentation around suspected boundaries rather than surrounding every line with timers. Useful boundaries include request parsing, authentication, serialization, queue acquisition, ORM execution, and response compression.
Instrumentation has overhead and can produce overwhelming data. Sample ordinary traffic, but ensure slow traces and error traces are retained at a sufficiently useful rate.
🧵 Inspect Queues, Threads, and Event Loops
Not all server time is active computation. A request may wait for a worker thread, a database connection, a semaphore, a rate-limit token, or an event-loop turn. Waiting often becomes visible only under concurrency.
In a thread-per-request server, exhausted worker threads can create an application queue even when individual handlers are efficient. In event-loop systems, blocking CPU work or synchronous I/O can delay unrelated requests sharing the same loop.
Measure queue wait separately from execution time. Scaling workers may help an underprovisioned service, but it can make a constrained database worse by increasing concurrent query pressure.
🧠 Profile Application CPU and Memory Carefully
If the trace points to application work, use a profiler in a representative environment. CPU profiles reveal where processors spend time; allocation profiles reveal object creation that may increase garbage-collection pressure.
Common surprises include serializing oversized JSON, repeatedly parsing the same data, inefficient regular expressions, accidental nested loops, and decompressing or encrypting large payloads on request threads.
Profile under conditions resembling the problem. A microbenchmark on a laptop may miss production data size, contention, runtime configuration, and network behavior. Treat profile results as evidence to validate, not an automatic patch list.
🧺 Check Cache Behavior, Not Just Cache Presence
A cache is useful only when the requested data can be reused and the cache is reachable quickly. Track hit rate, miss rate, lookup latency, evictions, key cardinality, and whether many requests miss the same key simultaneously.
A cache stampede happens when numerous requests discover an expired or missing value and all recompute it. Techniques such as request coalescing, short-lived stale responses, or controlled refresh can reduce duplicate work.
Also examine cache key design. A key that includes an unnecessary per-user field may turn shared data into almost entirely unique entries, producing a costly cache that rarely avoids database work.
🔌 Measure Downstream Service Calls
The database is often blamed because it is visible, but an API may spend most of its time waiting for another service: identity, payments, search, email, object storage, or a third-party API.
For each dependency call, capture duration, status, endpoint or operation name, retry count, and timeout outcome. Separate connection establishment from response wait where the client library allows it.
Set timeouts intentionally. A timeout should reflect the caller’s remaining deadline and the operation’s value, not an arbitrary large number. Propagating deadlines prevents one slow dependency from consuming the entire request budget.
🧮 Watch for Serial Dependency Chains
Several individually acceptable calls can create an unacceptable request when performed one after another. Suppose a handler fetches a profile, then permissions, then recommendations, then inventory. Their latencies accumulate.
Ask whether independent calls can run concurrently, whether one response can carry needed data, or whether the endpoint should return a smaller initial result. Parallelism is not free: it can increase load and complicate partial-failure handling.
A trace makes the distinction visible. A staircase of child spans suggests serial work; overlapping spans suggest concurrent work. Optimize the critical path, not whichever call merely looks most familiar.
🗃️ Distinguish Database Pool Wait from Query Time
“Database time” is often a misleading aggregate. An application may spend 800 ms waiting for an available connection and only 15 ms executing SQL. Optimizing the query will not remove the primary delay.
Instrument connection acquisition, transaction duration, query execution, and result fetching as distinct phases. Monitor pool occupancy and waiters alongside database connection limits and server load.
A larger pool is not universally better. Too many active connections can increase database contention, memory use, and context switching. Pool sizing must reflect database capacity, request concurrency, and the work each connection performs.
🔎 Capture the Actual SQL Shape
Once execution time is truly slow, inspect the actual query shape: SQL text or normalized fingerprint, parameter types, selected columns, row count, execution duration, and transaction context. Never assume the ORM generated the query you intended.
ORMS can hide expensive behavior. Fetching a parent list and then issuing one child query per parent is the classic N+1 pattern. It may look harmless with three records and become costly with hundreds.
Log safely. Parameter values may contain personal or confidential data, so use redaction, allowlists, hashing where appropriate, or query fingerprints rather than blindly recording every value.
🗺️ Read Query Plans Instead of Guessing at Indexes
A query plan describes how the database intends to retrieve and combine data. Depending on the database, an explain tool may show scans, index use, join order, estimates, sorting, and aggregation steps.
Compare estimated rows with actual rows when the database can provide both. Large differences can indicate stale statistics, skewed values, or predicates whose selectivity is hard to estimate. These mismatches can lead the optimizer to choose a poor plan.
An index can help filters, joins, ordering, or grouping, but it has write and storage costs. Add one because it supports the observed access pattern and plan—not simply because a slow query contains a WHERE clause.
🔒 Investigate Locks and Long Transactions
A fast query can wait a long time for a lock held by another transaction. This is especially likely when transactions include more work than necessary, update popular rows, or hold locks while making remote calls.
Inspect lock waits, blocking sessions, deadlocks, transaction age, and isolation settings using your database’s operational tooling. The goal is to identify both the waiting request and the transaction that is blocking it.
Keep transactions focused and short where correctness allows. Do not weaken isolation casually to hide contention; isolation protects behavior that may matter more than raw throughput.
📦 Consider Result Size and Serialization
A database may produce rows quickly while the API remains slow because it fetches too many records, maps them into objects, serializes a large JSON document, compresses it, and sends it across a limited network connection.
Measure rows returned and response bytes. A list endpoint without pagination can work in development and degrade sharply when real accounts accumulate data.
Return the data the screen needs, not every field that might be useful someday. Pagination, field selection, summaries, and purpose-built read models can reduce both server work and perceived wait.
🧪 Reproduce Without Losing Production Context
A controlled reproduction is valuable, but “it is fast on my machine” is not a conclusion. Production differences include data volume, index state, traffic concurrency, network location, CPU limits, configuration, and background jobs.
Use a sanitized production-like dataset where policy permits. Replay a representative request shape, including realistic parameters and concurrency, then compare trace stages rather than only comparing total duration.
If the failure is intermittent, preserve evidence from the incident: trace IDs, timestamps, deployment versions, dependency health, and relevant metrics. Reproduction may come later; evidence disappears quickly.
📊 Compare Healthy and Slow Requests
One slow trace is useful, but comparison prevents overfitting to an unusual case. Find a healthy request to the same route with a similar response size and, if relevant, similar tenant or parameter shape.
| Stage | Healthy request | Slow request | Likely question |
|---|---|---|---|
| Gateway upstream time | Low | High | Is the origin service delayed? |
| DB pool acquisition | Near zero | High | Is connection capacity saturated? |
| SQL execution | Similar | Similar | Is SQL really the bottleneck? |
| Response bytes | Small | Large | Is payload size driving work? |
The comparison often turns a vague complaint into a specific hypothesis: slow requests might all share a cache miss, an unindexed filter, or a particular region.
🚦Use a Latency Budget to Guide Decisions
A latency budget allocates a target response time across major stages. It is not a promise that every request will fit perfectly; it is a design tool for deciding where time may be spent.
For example, an interactive endpoint might reserve time for network transit, edge processing, application work, dependencies, and a safety margin. If one dependency consumes most of the budget, the team can discuss caching, concurrency, fallback behavior, or a different product flow.
Budgets also make timeout decisions coherent. A downstream call should not receive a timeout longer than the caller can wait and still return a useful result.
🛠️ Fix the Bottleneck You Measured
Choose a remedy that matches the demonstrated cause. A slow query may need a plan-aware index, reduced data scanned, corrected joins, or precomputed data. Pool wait may require shorter transactions, lower concurrency, or capacity changes. CPU work may need a more efficient algorithm or asynchronous processing.
Validate after deployment with the same measurements that identified the issue. Check not only median latency but tail latency, error rate, resource use, and behavior under representative load.
A local improvement can move pressure elsewhere. Parallelizing dependency calls may reduce endpoint duration while overwhelming a shared service; caching may reduce database load while introducing staleness that the product must tolerate.
⚠️ Avoid Common Investigation Traps
Several habits make tracing slower and less reliable:
- Starting with a favorite fix: adding indexes, cache layers, or servers before finding the slow stage.
- Trusting averages alone: tail latency and intermittent failures disappear in a single mean.
- Ignoring queue time: work can be fast once it begins but still arrive late.
- Logging secrets: debugging data must obey security and privacy boundaries.
- Changing many variables: bundled fixes make it difficult to know what helped or harmed.
The disciplined alternative is modest but powerful: form a hypothesis from telemetry, change one meaningful thing, and measure the outcome.
🧰 Build Observability Before the Next Incident
The best time to add tracing is before an urgent outage. Standardize correlation IDs, trace propagation, route-level metrics, dependency spans, database timing, dashboards, and alert thresholds that reflect user impact.
Document ownership boundaries too. Teams should know who can inspect gateway logs, application traces, database plans, and infrastructure metrics. Fast collaboration depends on shared evidence rather than handoffs based on suspicion.
Run occasional trace reviews for important endpoints. They reveal gradual drift, such as added serial calls, growing payloads, or an endpoint that has quietly accumulated too many responsibilities.
✅ A Practical Trace Checklist
When a report arrives, work from outside in, then follow the evidence inward:
- Capture a real slow request, its timestamp, route, client context, and trace ID.
- Separate UI delay, network delay, edge delay, and server duration.
- Read the distributed trace and identify the critical path and unexplained gaps.
- Check queueing, cache outcomes, retries, and downstream calls.
- Separate database pool wait, SQL execution, lock wait, and result transfer.
- Compare slow and healthy requests with similar shapes.
- Apply the smallest cause-matched fix and validate with production telemetry.
This sequence prevents the database from becoming the default suspect simply because it is the last layer in the stack.
🏁 The Core Principle: Follow Evidence, Not Assumptions
A slow API request is an end-to-end systems problem. The visible delay belongs to the user, even if its technical cause sits in a browser render, a gateway queue, application code, a remote dependency, or a blocked database transaction.
Good tracing converts that broad problem into timed boundaries and connected events. It tells you where the request waited, what it depended on, and which component owns the next useful question.
The goal is not to instrument everything forever or chase every millisecond. It is to make the system observable enough that meaningful slowness can be explained, prioritized, and improved with confidence.
Trace the whole journey, isolate the critical path, and optimize the stage that actually consumes the user’s wait. That is how performance work becomes a repeatable engineering practice rather than a guessing game. ⚙️🔍📈