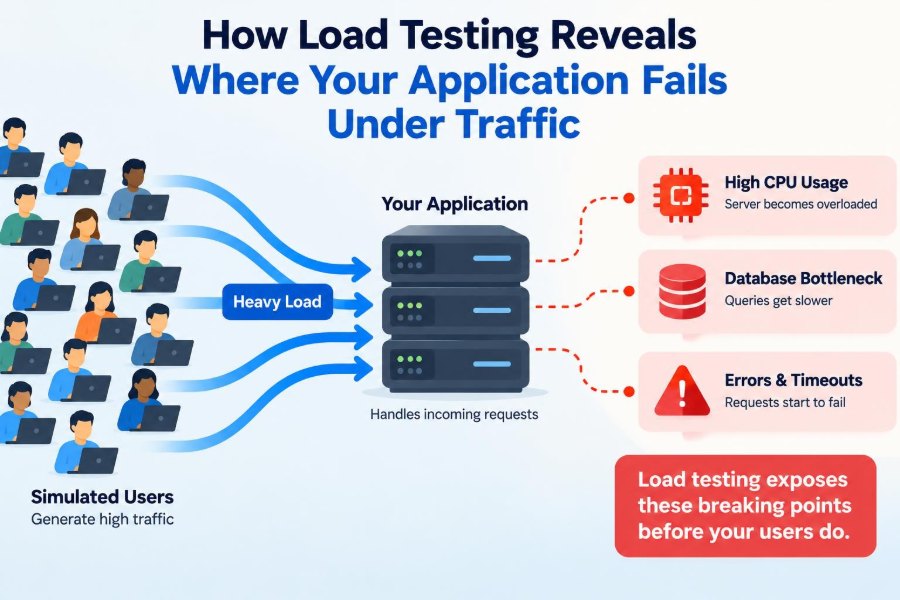

A product launch is going well. A marketing campaign is live, new users are signing in, and dashboards show traffic climbing exactly as the team hoped. Then the application begins to slow down: pages spin, checkout requests time out, and a few users see errors that engineers cannot reproduce on their laptops.
These incidents are rarely caused by “too many users” in the abstract. They emerge from specific limits: a saturated database connection pool, an expensive query, a queue that cannot drain fast enough, a third-party dependency, or code that behaves poorly when many requests arrive together.
Load testing is the practice of applying realistic demand to a system and observing how it behaves. Done well, it turns vague fears about scale into evidence about capacity, bottlenecks, failure modes, and recovery.
For students, it connects performance theory to real systems. For working professionals, it creates a safer way to discover weaknesses before customers, partners, or an unexpected event discovers them first. 📈
🎯 1. What Load Testing Actually Measures
A load test runs an application under an expected or planned level of traffic. Test clients send requests, execute user journeys, or publish messages while engineers collect timing, error, resource, and dependency data.
The purpose is not simply to produce a large number of requests per second. It is to determine whether the system meets meaningful expectations when concurrent work, data access, network activity, and background processing occur together.
- Response time: how long a request or transaction takes.
- Throughput: the useful work completed over time.
- Error rate: failed requests, rejected work, or incorrect responses.
- Resource use: CPU, memory, connections, disk, and network capacity.
🚦 2. Why a Fast Laptop Test Is Not Enough
Local testing usually has tiny datasets, short network paths, warm caches, and one person exercising a feature at a time. Production-like traffic changes all of those conditions.
Concurrency creates contention. Multiple requests may compete for the same database rows, thread pools, file handles, locks, cache keys, or limited external-service connections. A path that is quick in isolation can become slow when it waits behind other work.
Load testing exposes these interactions before they become a public outage. ⚠️
🧭 3. Begin With a Question, Not a Tool
A useful test starts with a decision the team needs to make. “Can the new checkout flow handle a campaign?” is clearer than “let’s run a performance test.”
State the workload, the duration, the user behavior, and what counts as acceptable. This prevents teams from celebrating an impressive graph that does not answer a business or engineering question.
- Can the API sustain normal peak usage with acceptable latency?
- What component limits the service as traffic rises?
- Does autoscaling maintain service during a gradual increase?
- How does the system recover after a dependent service becomes slow?
👥 4. Model Users, Not Just Requests
Users do not usually send an endless stream of identical requests. They arrive, browse, pause, search, add items, submit forms, and sometimes abandon a workflow.
A workload model represents these actions and their relative frequency. For an online store, product browsing may be far more common than payment submission; for an internal system, report generation may be rare but expensive.
Mixing realistic journeys matters because one journey can populate caches or consume shared resources needed by another.
📏 5. Define the Performance Contract
A performance contract is a practical statement of the service level a team intends to support. It should describe outcomes, rather than relying on a single average response time.
For example, a team may require that a critical transaction completes within a chosen target for most successful requests, that errors remain limited, and that queues do not grow without bound during the planned workload.
Targets should reflect user needs, product risk, and system architecture. They are engineering agreements, not universal numbers.
⏱️ 6. Understand Latency Distributions
An average can hide a painful experience. If most requests are fast but a smaller group waits much longer, the average may look acceptable while affected users repeatedly experience failures or delays.
Percentiles describe the distribution. A high percentile asks how slow requests near the slow end are, without allowing a few extreme values or many very fast values to dominate the result.
| Measure | What it helps reveal | Common limitation |
|---|---|---|
| Average latency | General central tendency | Can hide slow-user experiences |
| Median latency | Typical request experience | Does not describe the tail |
| High-percentile latency | Slow requests under load | Needs enough samples and careful interpretation |
| Maximum latency | Extreme observed delay | May be unstable or caused by an outlier |
📈 7. Throughput Is Useful Work, Not Incoming Pressure
Throughput measures completed work, such as successful requests or processed jobs. A generator can send more traffic than the application can handle, but that does not mean the application is delivering more value.
When offered load rises while completed work stops growing, a bottleneck may have been reached. If errors then increase and latency climbs, the system may be overloaded rather than merely busy.
Always compare attempted work, successful work, failed work, and work still waiting.
🧪 8. Choose the Right Test Shape
Different traffic patterns reveal different weaknesses. A single test type cannot answer every performance question.
Useful workload shapes
- Baseline test: establishes behavior under a small, steady workload.
- Load test: evaluates expected operating demand.
- Stress test: pushes beyond expected demand to locate limits.
- Spike test: applies a rapid traffic increase.
- Soak test: sustains demand long enough to reveal gradual degradation.
Choose the shape that resembles the risk you are investigating.
🌡️ 9. Ramp Up Instead of Starting With Chaos
A gradual ramp increases load in stages. This makes it easier to connect a behavior change to a level of demand and lets systems that scale asynchronously react as they would in practice.
At each stage, observe whether latency, errors, saturation, and queue depth remain stable. A sharp change can indicate a threshold: perhaps a connection limit, an exhausted worker pool, or a cache that no longer fits useful data.
An immediate spike is also valuable, but it answers a different question.
🗺️ 10. Test the Whole Request Path
A user-facing response often passes through a browser or client, edge infrastructure, an API gateway, services, caches, databases, message brokers, and external providers. Testing only one service endpoint can miss the path users depend on.
Map critical transactions from entry to completion. Include authentication, asynchronous steps, data persistence, notifications, and any downstream call needed before the user sees a successful result.
This map becomes the starting point for observability during the test.
🧱 11. Bottlenecks Move as Load Changes
The first bottleneck is not always the final one. After an inefficient query is fixed, CPU pressure in application workers may become the next constraint. After workers are added, a shared cache or database may become limiting.
This is why capacity work is iterative. Treat each test as an experiment: identify the limiting resource, change one or a small number of well-understood factors, then test again.
“It is faster now” is less useful than knowing why the limiting behavior changed.
🗄️ 12. Database Contention Often Appears Under Concurrency
Databases are frequent bottleneck candidates because they handle shared state, indexing, transactions, locking, storage, and limited connection capacity. An endpoint can look harmless until many requests execute it at once.
Watch slow queries, query counts, lock waits, connection pool usage, transaction duration, and storage behavior. Also inspect whether application requests are waiting for database connections before they even begin querying.
Load may reveal missing indexes, repeated queries, overly broad reads, or serialized updates to popular records.
🧵 13. Pools, Threads, and Workers Create Hidden Queues
Many components limit concurrent work deliberately: web-server workers, thread pools, database pools, HTTP client pools, and background-job consumers. These limits protect a dependency, but they also create waiting lines.
A queue is not automatically wrong. It becomes dangerous when arrival rate exceeds completion rate for long enough that waiting time grows and requests expire or users leave.
Measure active, idle, and waiting capacity rather than assuming every busy system is unhealthy.
🧠 14. Memory Problems Can Take Time to Surface
A short test may show stable latency even while memory use climbs. Long-running traffic can reveal leaks, unbounded caches, retained request data, fragmented heaps, or garbage-collection pressure.
Soak tests are especially useful here. Track memory over time alongside latency and process restarts. A repeating upward trend deserves investigation even if the application has not yet crashed.
Do not confuse a large memory footprint with a leak; look for growth that does not stabilize under a steady workload.
🔌 15. External Dependencies Are Part of Your Capacity
Payments, identity providers, map services, email platforms, and internal APIs can all slow or fail. Your service may have ample CPU while its request workers are blocked waiting for a dependency.
Include realistic dependency behavior where possible. If testing against a shared or production-like dependency is unsafe, use a controlled substitute that can reproduce normal latency, delayed responses, and failures.
Capacity is constrained by the weakest required link in a transaction. 🔗
🛡️ 16. Timeouts, Retries, and Backoff Can Help or Harm
Timeouts stop requests from waiting forever. Retries can recover from transient failures. But retrying too aggressively adds traffic precisely when a dependency is already struggling.
Test failure behavior under load. Confirm that timeout values are compatible across service boundaries, retries are limited, and backoff prevents synchronized retry storms.
Idempotency also matters: a client retry should not accidentally create duplicate orders, messages, or state changes.
📬 17. Asynchronous Systems Need Queue Observability
Message queues separate producers from consumers, which can improve resilience and smooth bursts. However, a successful enqueue does not mean the user’s intended work has finished.
Track queue depth, message age, consumer throughput, retries, dead-letter handling, and end-to-end completion time. A queue that grows during a short burst may be acceptable if consumers catch up; one that keeps growing signals insufficient processing capacity.
Test both the synchronous acknowledgment and the eventual business outcome.
🧊 18. Caches Change the Story
Caches can reduce repeated work dramatically, but a warm-cache test may hide the cost of misses. A cold cache, an expired popular key, or a cache outage can push suddenly increased demand onto databases and services.
Run separate scenarios for warmed and cold conditions when they matter. Observe hit rate, eviction behavior, key distribution, and what happens when many requests miss the same expensive item simultaneously.
Cache stampedes are a concurrency problem, not simply a caching problem.
📊 19. Correlate Metrics With Traces and Logs
A load-generator graph can tell you that latency rose. It usually cannot explain which operation consumed the time. That explanation comes from correlated telemetry.
- Metrics show trends in latency, errors, saturation, and rates.
- Traces show the path and timing of individual requests across components.
- Logs provide events, exceptions, and contextual details.
- Profiles can reveal costly code paths and allocation behavior.
Use consistent timestamps and request identifiers so evidence from these sources can be connected.
🔍 20. Read the Shape of Failure
Different metric patterns suggest different mechanisms. Rising latency with stable throughput can mean increasing queueing. Rising errors before CPU is high may point to a connection limit, rate limit, or dependency rejection.
A sawtooth memory pattern might be normal garbage collection, while steadily increasing memory under a fixed workload may not be. A sudden throughput plateau can mark a hard limit.
These are hypotheses, not diagnoses. Validate them by inspecting the relevant component and changing the test or system carefully.
🧮 21. Use Little’s Law as a Reasoning Tool
Little’s Law relates average items in a stable system, average arrival rate, and average time spent in the system. In a simplified form, L = λW, where L is work in progress, λ is arrival rate, and W is time in the system.
The practical insight is straightforward: when arrival rate stays similar but response time rises, more work accumulates in the system. That accumulation appears as concurrent requests, pool waiters, queued jobs, or open connections.
It helps teams reason about queueing without treating latency as an isolated number.
🧰 22. Build a Trustworthy Test Environment
A production-like environment is valuable because data volume, configuration, network topology, and dependency behavior affect results. Yet exact duplication is often impractical or unsafe.
Document meaningful differences: smaller datasets, shared infrastructure, mock dependencies, reduced instance sizes, or disabled integrations. This makes conclusions appropriately cautious.
Never allow test traffic to send unintended emails, charge cards, overwrite shared data, or expose personal information. Safe test data and clear isolation are essential.
🖥️ 23. Verify That the Load Generator Is Not the Limit
A test is only credible if the generator can create the planned workload. The generator itself may run out of CPU, sockets, network bandwidth, file descriptors, or client-side connections.
Monitor generator resources and distribute generation when needed. Confirm that the offered rate actually reaches the target system and that client-side timeouts are not being mistaken for server behavior.
One overloaded test machine can produce misleading conclusions about an otherwise healthy application.
🧾 24. Establish a Baseline Before Major Changes
A baseline records how a known version behaves under a defined scenario. It gives future tests a reference point and helps separate genuine regressions from ordinary environmental variation.
Store the scenario definition, application version, infrastructure configuration, datasets, key metrics, and observations. A result without this context is difficult to reproduce or compare.
Baselines are especially valuable after framework upgrades, schema changes, caching changes, and new integrations.
🔁 25. Turn Findings Into Engineering Work
A load test creates value only when its findings lead to action. Translate observations into concrete work: optimize a query, add an index, reduce payload size, bound a queue, improve a fallback, or revise an autoscaling rule.
For each change, state the expected effect and rerun the relevant scenario. This avoids attributing improvements to a change that merely shifted traffic or altered the test.
Useful result record
- The scenario and version tested.
- The observed limit or failure mode.
- The evidence supporting the diagnosis.
- The proposed change and owner.
- The retest result and remaining risk.
🚨 26. Treat Failure as Valuable Information
A test that causes errors is not automatically a failed testing effort. It may have located the exact condition where the system stops meeting its performance contract.
The goal is controlled failure, clear observation, and safe recovery. Record whether the application degraded gracefully, rejected excess work predictably, preserved data integrity, and recovered after demand returned to normal.
Systems do not need to handle infinite traffic. They need known limits and well-designed behavior near those limits.
🏁 27. The Core Principle: Make Capacity Visible Before Users Feel It
Load testing is an investigative discipline. It combines a realistic workload, explicit expectations, production-relevant telemetry, and repeated experiments to reveal how demand travels through a system.
The most important outcome is not a single maximum number. It is an evidence-based understanding of what limits the application, how it fails, what users experience, and which improvement will matter next.
When teams test realistic traffic early and learn from every bottleneck, they replace performance guesswork with informed engineering decisions. 📊 🛠️ 🚀